Does the crust wobble before some big earthquakes?
We deep-dive a 2020 Nature paper that discovered enormous crustal shifts before Mw9.2 and Mw8.8 megathrust earthquakes
Citation: Bradley, K., Hubbard, J., 2023. Does the crust wobble before some big earthquakes? Earthquake Insights, https://doi.org/10.62481/2597b170
If this post has reverted to behind a paywall, download a pdf here. All of our analyses of recent research papers are intended to be permanently free to read and comment to allow open discussion by the scientific community.
A paper published in Nature in 2020 documented large-scale back-and-forth shifts of Earth’s crust in 2009-2011 affecting both Japan and Chile. These ‘wobbles’ culminated in two of the largest megathrust earthquakes to occur in recent decades. In this post, we take a close look at the data and interpretations. Inspection of the data indicates that the direction and scale of wobbling are actually not consistent with a tectonic origin. Digging deeper, we find that the GPS time series have unusual features that appear to contribute to the ‘wobble’ signal but are likely non-physical. In our assessment, it seems more likely that the observed wobbles arise from correlated noise in the GPS data, rather than actual tectonic motions.
Note (November 3, 2023): The original post switched the names of Honshu and Hokkaido. The text and figures have been corrected to reflect the correct names. Thanks so much to our readers who highlighted this transposition!
The last years have witnessed an increasing number of high-profile research papers that claim to identify precursory behaviour before large earthquakes. These papers make a splash because they resonate with two separate audiences: the earthquake scientists who want to know how large earthquakes start from a physical perspective, and the much larger audience of people who simply want to know whether large earthquakes can be effectively predicted.
There are many challenges to identifying true earthquake precursors. After all, if they were common and easily observable, they would already be well studied and hopefully well understood. If we could reliably identify precursors to large earthquakes, we could establish temporary networks of instruments around upcoming earthquakes and capture the evolution of the rupture process in greater detail.
Instead, most earthquakes do not seem to have any observable precursors, and in general precursory behaviour is only identified or proposed after large earthquakes have occurred. Most studies therefore look back retrospectively at data that were acquired before large earthquakes happened, with the goal of finding some kind of unusual signal in the period leading up to the earthquakes. When such signals are found, the studies can then propose a physical mechanism that relates the signals to the earthquakes that ultimately happened.
If a pre-earthquake signal can be verified as real, and if a reasonable physical explanation for the signal can be made, then perhaps a precursory behaviour has in fact been discovered. Whether that observation is general, predictive, or just a coincidental feature of those specific earthquakes, can then be studied further.
Once again, however, the simple fact is that precursory behaviour must be extremely subtle or rare, or else it would already be widely known. Studies that search for precursory behaviour therefore tend to be forensic in nature, usually sorting through noisy data to try to find subtle precursory signs that have been missed by earlier studies. These studies tend to use newly developed methods to try tease out signals.
One such paper published in 2020 in Nature claimed to identify spectacular, large-scale and long-duration “wobbles” of the Earth’s crust in the months preceding two great subduction earthquakes.
Here, we take a close look at the paper to see whether the observations and interpretations hold up - at least in our opinions. Like our other close readings of papers, we are making this post permanently free to read, with open comments, to encourage open discussion.
Our post is organized in sections that become increasingly more arcane as we deal more directly with the data. Luckily, some of our main points are related to tectonics and can be found as early as section 2. Those with greater interest in the data and methods can find further details in the later sections.
What the paper says
Are the wobbles consistent with tectonics?
A closer look at wobbly GPS data in Japan
A closer look at the GrAtSiD method
Our take-aways
1. What the paper says
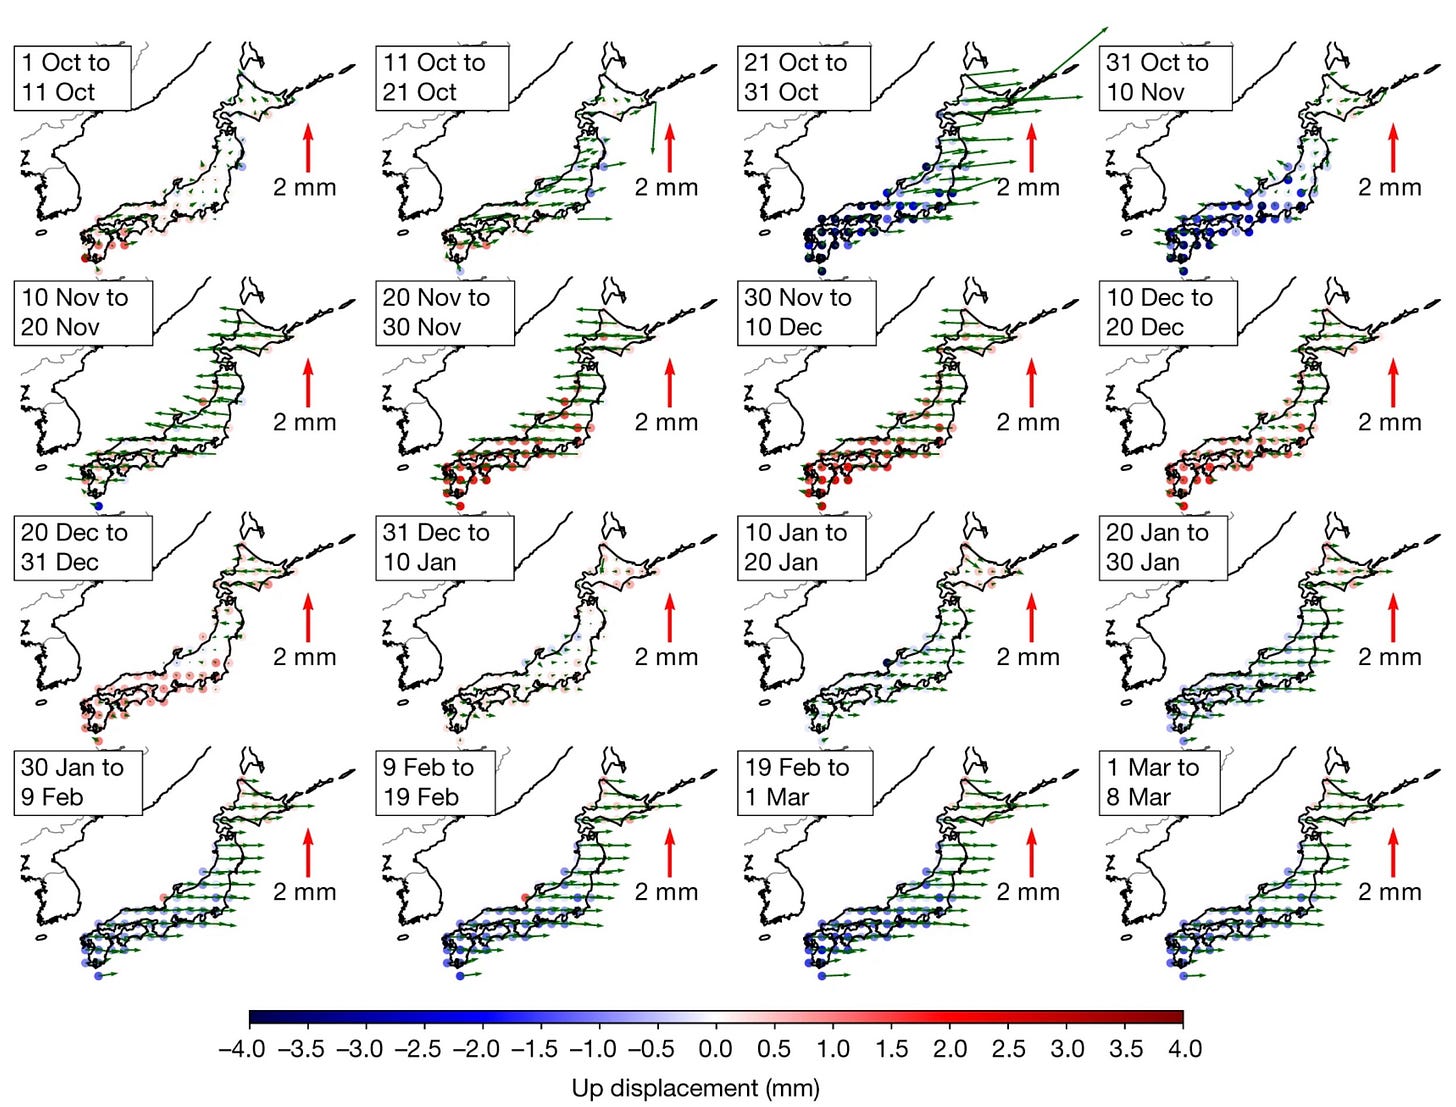
Bedford et al. (2020) examined GPS data from Japan and South America, and found evidence for large-scale back-and-forth shifts of Earth’s surface in the year leading up to two different great earthquakes - the 2011 Mw9.2 Tohoku-Oki earthquake, and the 2010 Mw8.8 Maule earthquake (Figure 1 shows the wobbles in Japan). These are two of the most intensively studied earthquakes in modern times, because they were both very large magnitude and occurred during the recent period when excellent observational data from those areas were available.
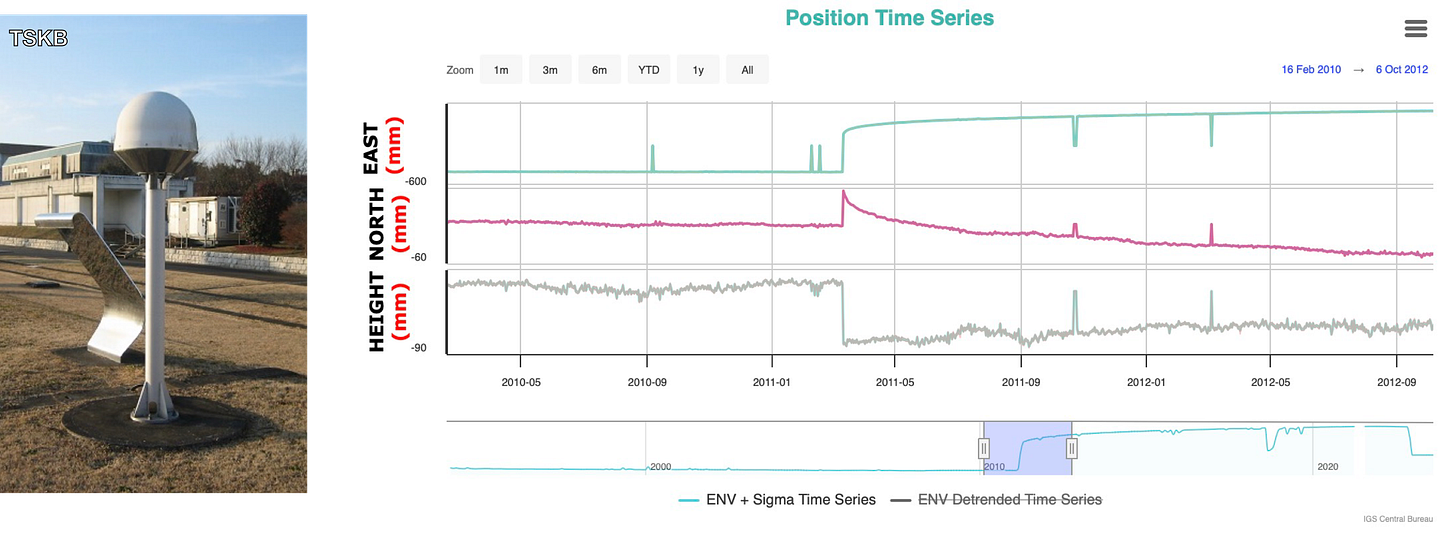
Bedford et al. (2020) rely entirely on GPS time series data from Japan and South America (in this post, we will use the term GPS generically, rather than differentiating between GPS, GNSS, and other related satellite-based location systems). A GPS time series is made up of repeated estimates of the precise location of a stationary GPS monument. Because each monument is (hopefully) fixed strongly to the Earth, its recorded motion is generally a good estimate of the actual motion of the ground. The motion of each site is usually plotted in three different dimensions, or components: East, North, and Up.
Figure 2 shows a rather famous GPS monument in Tsukuba, Japan, which we will discuss later. The time series of the East, North, and Up (Height) components are shown at right. You can explore this data, and all International GNS Service stations, at this awesome IGS website.
GPS time series data are routinely used to study tectonic motions and the earthquake cycle. In fact, some of our best knowledge about the physics of fault slip comes from GPS time series data, and earthquake scientists have become very comfortable interpreting the most common signals of ground deformation. However, back-and-forth wobbles of the Earth surface over distances of 1000+ kilometers, and lasting for months, are unprecedented.
So, what do the time series of Bedford et al. (2020) look like? Figure 3 shows the East component of representative sites, with Japan on the left and South America on the right. Each color indicates a different GPS monument. The top panels show the original (uncorrected) data, and the lower time series panels show the data after corrections applied in the paper. Each time series has been adjusted to remove the average motion over the five-year period, so the curves are approximately horizontal on average. The shaded gray areas indicate the period with strong back-and forth wobbles.
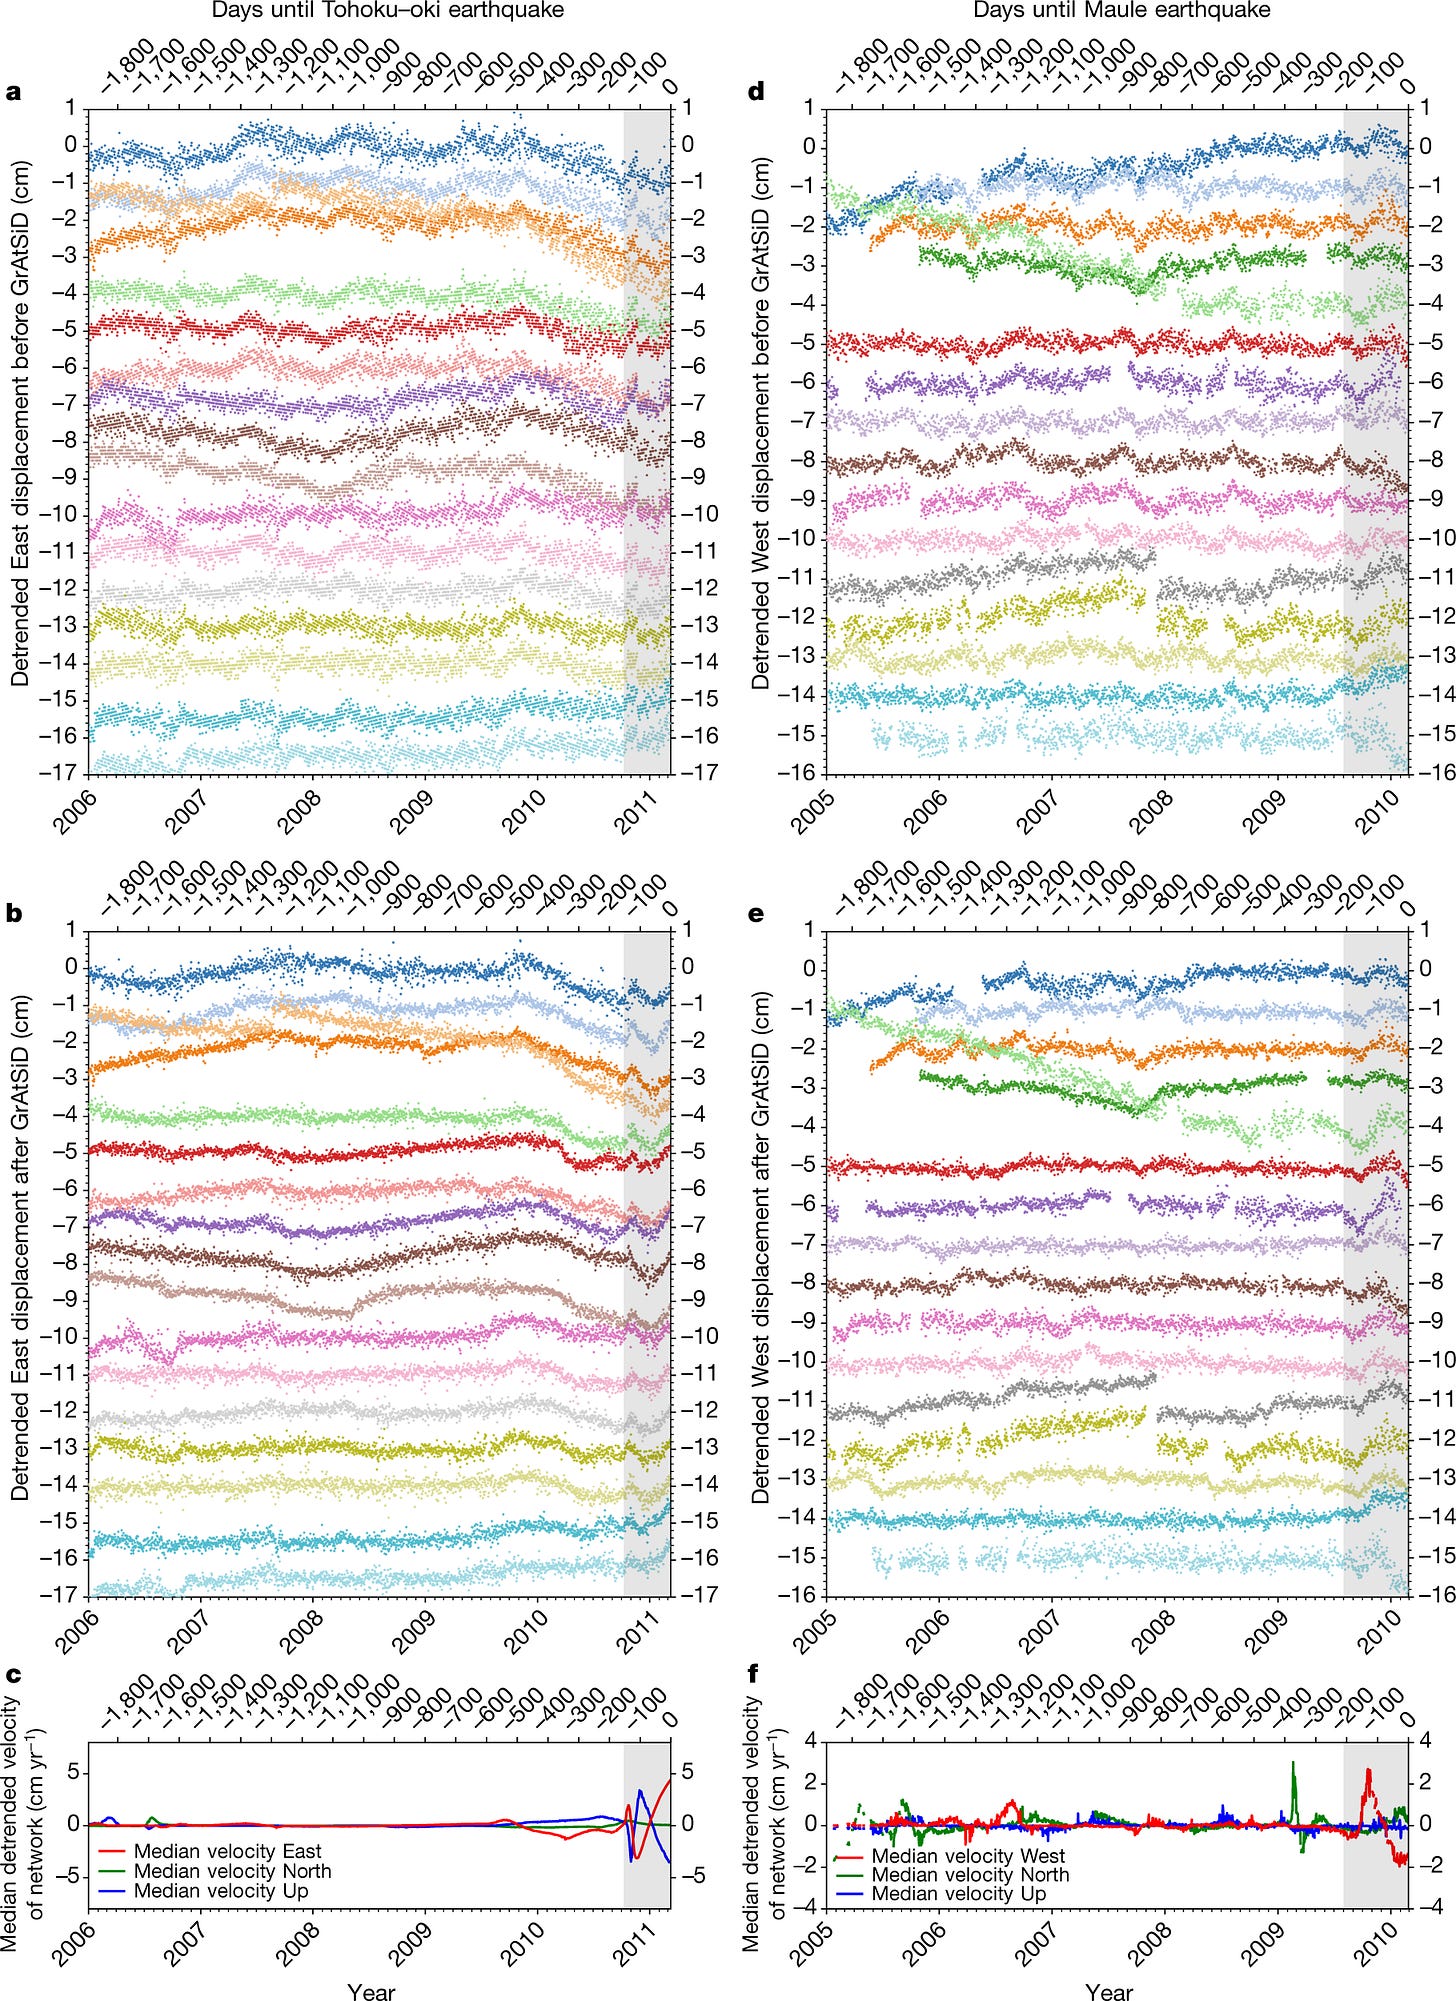
In Japan, from 2006 to late 2009, the time series are mostly flat - the stations are mostly moving steadily in one direction or another due to plate tectonics. In late 2009, there is a broad change in direction. Then, in late 2010, there are several more abrupt reversals over a period of about five months. All of the stations in the network seem to be experiencing accelerations and decelerations, moving faster east, then west, then east again. These are the “wobbles.” The Tohoku-Oki earthquake occurred on March 11, 2011.
A similar pattern can be seen in Chile. After a relatively stable period from 2005 to late 2009, in August 2009, the stations start moving together: east, then west, then east. The Maule earthquake occurred on February 27, 2010.
You can watch the wobbles in Japan happen via a movie from the supplemental files of the paper (other movies exist for South America as well). The motions are pretty dramatic!
Video 1: A video provided by the authors in the supplementary information to the paper, showing the back-and-forth wobbling in Japan.
What could cause this ‘wobbling’? The paper calls on a surprising mechanism: geochemical reactions in the deep, subducting slabs that lie beneath Japan and western South America.
Let’s take a look at the case of Japan, which has by far the most and best data. The authors suggest a series of tectonic events, illustrated in the diagrams below (Figure 4).
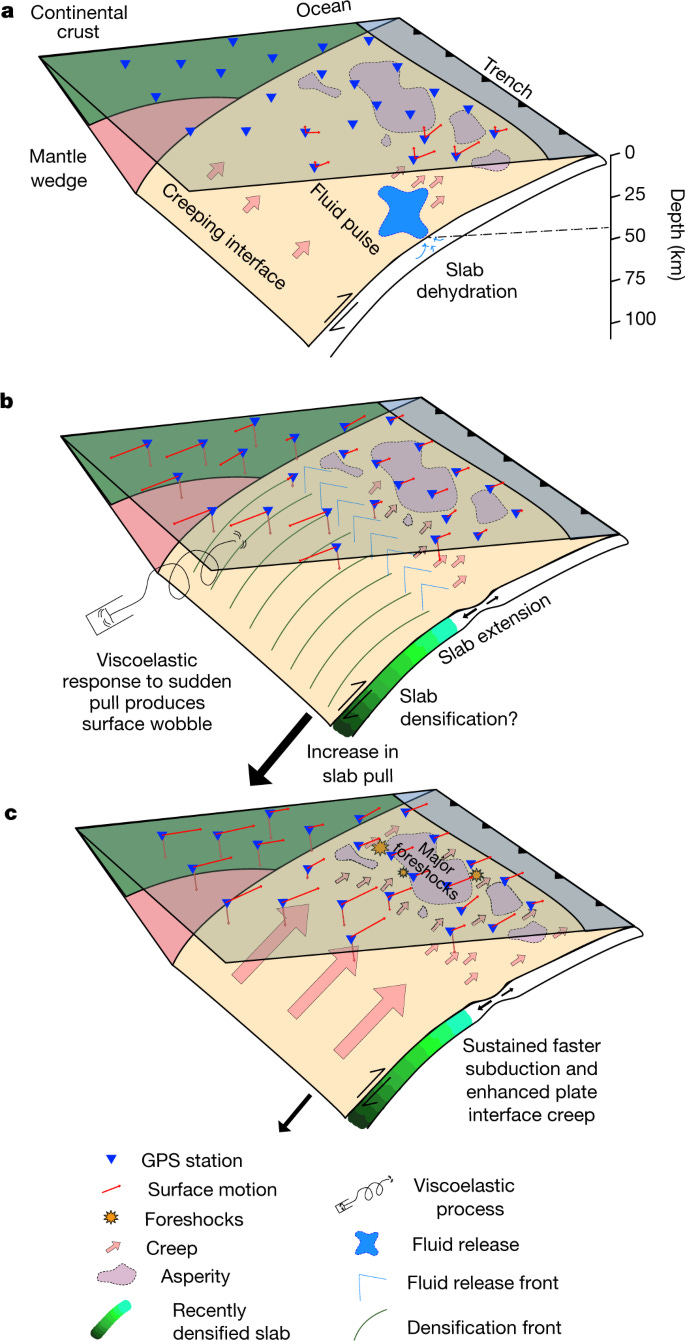
Step 1 (panel a): The subducting slab releases fluids onto the plate boundary fault, allowing the fault to slip at speeds too low to generate seismic shaking. GPS sites near the slow slip event move Up, and also move East toward the sea.
This is a somewhat plausible process: subducting slabs are known to carry fluids into the Earth, trapped within mineral structures. As those minerals are exposed to higher temperatures and pressure, the water cannot stay inside the minerals and fluids are released - this is what causes volcanism above subducting slabs. Fluids trapped along fault surfaces can reduce the effective friction, making it easier for the faults to slip. So, the idea that slab dewatering can drive episodes of aseismic slip on megathrusts is geologically reasonable, at least to some degree.
Step 2 (panel b): Part of the slab below this region of creep suddenly experiences a geochemical reaction that causes it to become denser, creating a rapid downward “pull” on the slab. GPS sites move Down and West.
Minerals in the subducting slab experience changes in their crystal structure as they move deeper and are exposed to higher pressures, generally increasing in density. This can happen abruptly - one area of sudden phase shift may be able to trigger a nearby area to experience the same shift, causing a type of runaway reaction. This kind of mechanism has been proposed to explain ultra-deep earthquakes, which occur at depths where rocks should be too hot to fracture under external stresses.
Slab pull is believed to be one of the primary tectonic forces that drives ongoing movement of Earth’s tectonic plates: tectonic slabs are denser than the surrounding mantle, so they sink down, pulling the rest of the plate behind them. The earthquakes that we see in subduction zones - from the surface to great depth - are all in some way expressions of this fundamental force. So, the idea that slabs can experience metamorphic reactions that lead to stronger slab pull forces is also geologically reasonable, at least to some degree.
Step 3 (panel c): The combination of enhanced slab pull and fluid release causes the initiation of foreshocks that then lead to the Tohoku-Oki earthquake. GPS sites move East toward the sea, but can still move Down in the area above the sinking slab.
In the proposed model, the end result of these competing effects is a back-and-forth ‘wobble’ of the Earth’s surface that moves around over space and time, as the slow slip and slab pull both evolve and compete.
Because it is difficult to understand how these two effects can combine to cause the observed wobbles, the authors built a type of numerical model that acts mostly as a visual aid (Figure 5). The model shows the expected pattern of slip on the subduction interface (the earthquake-generating megathrust and its deeper extension into the mantle), IF slip on the interface driven by the slow slip and slab pull were the only thing happening. This is explicitly NOT what is happening (the authors are very clear about this). Because this model is so non-physical, we won’t go into too many details about it here.
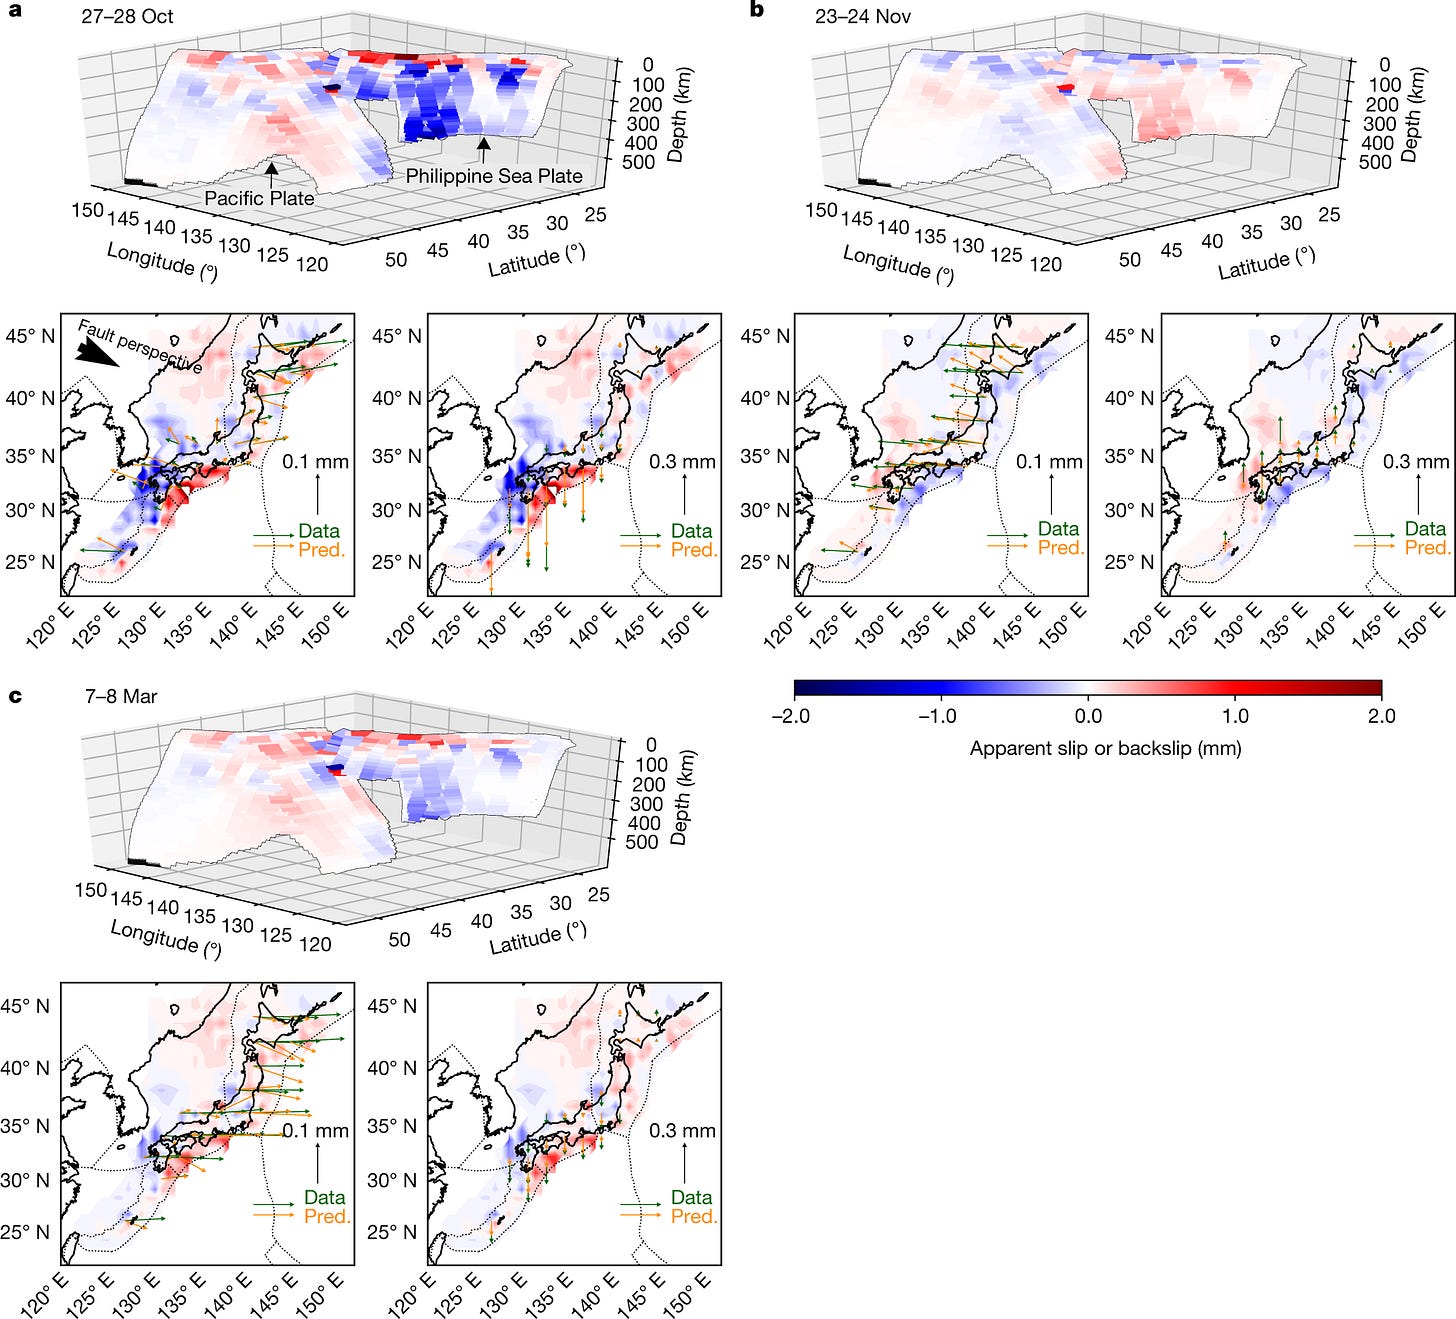
What about South America? The conceptual model for that region is a little different. Because the wobbles move in a different direction (first toward the overlying plate, then away, rather than the reverse), the physical explanation can’t be exactly the same. So the authors propose that the slab pull happened first, followed by a large slow slip event triggered by the new forces acting on the megathrust. When the slow slip ended, the slab pull (and eastward movement) remained. So, the players are the same, but the interactions seem to be different.
The scale of the crustal wobbles, in both space and time, are pretty amazing. In addition, the authors note that the wobble in Japan actually starts in the south near Taiwan and moves northward over time (Figure 6), suggesting that the original source of the disrupting force is in the south.
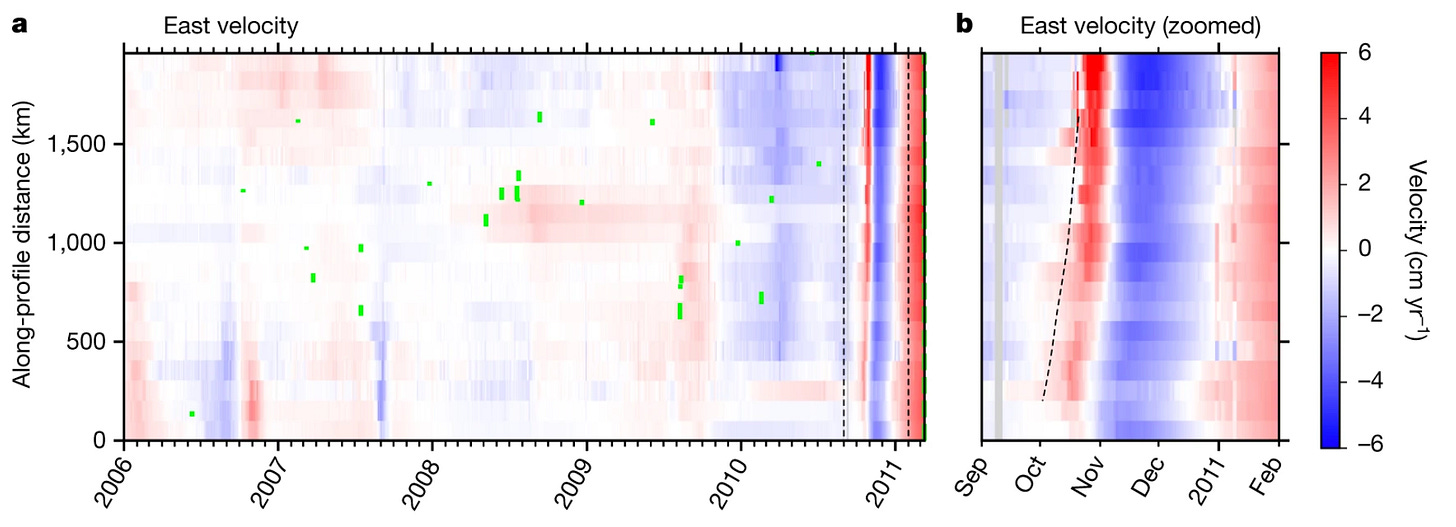
If the observations and interpretations in this paper hold up, it suggests that routine monitoring of crustal motions by GPS networks or other geodetic methods like InSAR (see some of our previous posts on that method) could potentially anticipate some of the most dangerous forthcoming earthquakes, with months to years of warning.
Now, it is important that we don’t overstate the case: the authors clearly say that they don’t know whether wobbles should always end in great subduction earthquakes. They suggest that the megathrust faults just happened to be ready to break, and that the wobbles were the tipping point. However, the title of the paper and the proposed physical model gives the strong impression that there may be an important causal relationship between wobbles and great earthquakes. If we saw a new period of wobbling begin on a subduction zone this year, these results would certainly give us cause to be concerned. So to us at least, this paper reads as a study of precursory behaviour for large megathrust earthquakes.
From a more general perspective, if the proposed mechanism causing the wobbles is real, then we seem to have access to a new and unexpected window into one of the driving forces of plate tectonics. The forces that drive plate motions are a long-standing subject of interest, and the physical mechanism proposed by Bedford et al. (2020) to explain the wobbles is an unprecedented observation that links deep Earth processes to rapid changes in surface motion.
2. Are the wobbles consistent with tectonics?
We will start our analysis by trying to determine whether the wobbles make tectonic sense.
One important consequence of plate tectonics is that processes occurring at increasingly larger length scales on Earth actually become increasingly easier to understand. This is because the surface of the Earth is broken into only a few very large plates and some number of smaller plates, which move in an extremely predictable fashion. While deformation due to an earthquake on a small fault is probably related to complex local geology (for an example, see the recent Mw6.3 earthquake in Morocco), tectonic deformation on the scale of 1000 kilometers must be related to plate motion and must be consistent with the known motions of the plates.
When we looked at all of the figures presented in Bedford et al. (2020) - including all of the extended data figures and movies - it struck us that the motions appeared particularly non-tectonic. This is in direct disagreement with the authors, who use the same data patterns to argue that the signal is tectonic. So, we need to clearly explain our reasoning. We mainly discuss the case of Japan, where the wobbles are clearest and the data are more abundant.
First, it is important to remember that Japan has multiple subducting slabs and plate boundary faults to worry about (Figure 7 shows the geological structures and also has place names). The Kuril slab represents the oceanic crust of the Pacific Plate subducting Westward beneath Northern Honshu and Hokkaido. The Ryukyu slab represents the oceanic crust of the Philippine Sea Plate subducting Northwestward in the region between Taiwan and southern Honshu. The Izu-Bonin slab represents the oceanic crust of the Pacific Plate subducting Westward beneath the Philippine Sea Plate along the Izu and Bonin islands. In addition, the Manila slab represents the Sunda Plate subducting Eastward beneath the Philippine Sea Plate in Taiwan and Luzon.
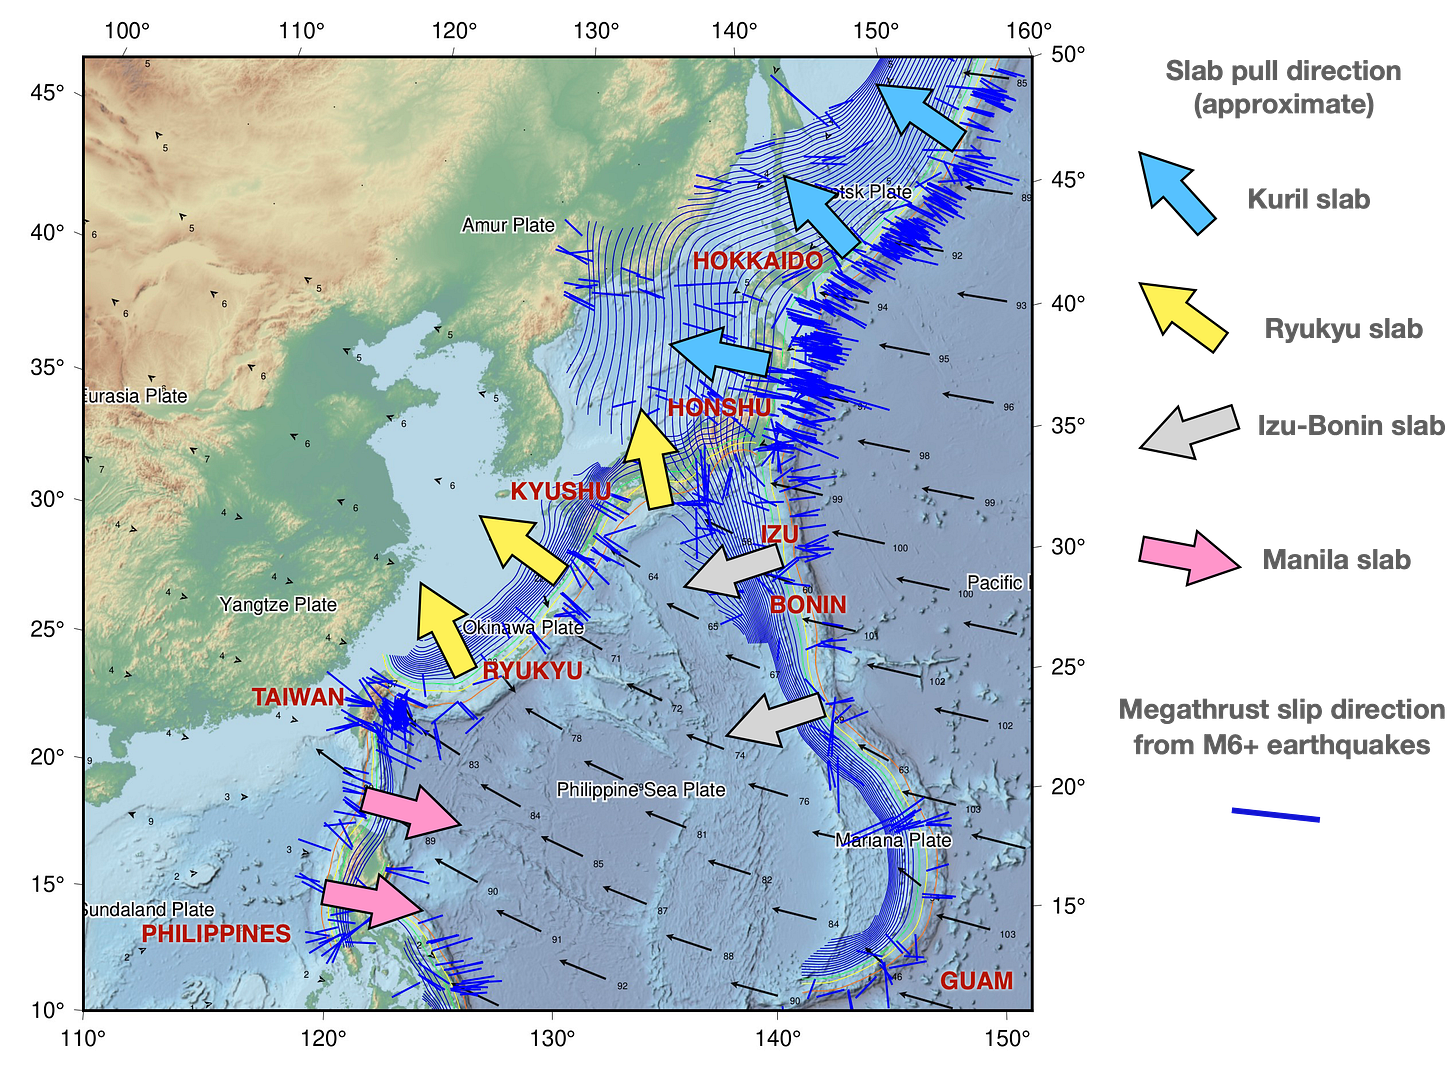
Figure 7 is our attempt to summarize the large-scale tectonic motions around Japan. The black arrows show the directions of plate motion, relative to the Amur Plate (northeast China). The slab pull force acts along the down-dip direction of each slab, so we can eyeball it as being perpendicular to the contour lines of the Slab2.0 model. Note that the slab pull force is only aligned perfectly West in northeastern Honshu. In Hokkaido, it is aligned toward the Northwest. In Ryuku and southern Honshu, it is directed northwest to north, and south of Taiwan, it is directed East. At Izo-Bonin, it is directed West-Southwest.
Unsurprisingly, the slip directions of the shallow megathrust faults (measured from earthquakes) are closely aligned with the slab pull forces. The dark blue lines in Figure 7 show the P-axes of focal mechanisms for Mw6+ earthquakes. In plain English, the dark blue lines basically show the direction of earthquake slip on the megathrust faults. The fact that the blue lines are parallel to the slab pull direction, and similar to the local plate motion direction, basically means that plate tectonics is working as expected in this part of Earth’s crust.
So, in order to try to objectively interpret the wobbles as tectonic vs non-tectonic signals, we can set a few reasonable ground rules.
Rule #1: The direction of the wobble should match the direction of tectonic forces
If a large section of a megathrust fault slips due to a decrease in effective friction (such as from fluid migration, as proposed in the paper), the resulting motion should be in the same direction as the blue lines in the figure above, toward the subducting plate.
If a sudden increase in slab pull causes more rapid subduction of the deep slab, the resulting motion of Earth’s surface should basically be in the direction of the slab pull force (the direction of the large arrows in the figure above).
Rule #2: The spatial extent of the wobble should match possible tectonic signals
Aseismic slip on a megathrust will only noticeably affect the Earth’s surface within a “reasonable” distance of the slipping patch.
Deformation due to enhanced slab pull will only affect the Earth’s surface within a “reasonable” distance of the downward-moving slab.
So, let’s go through these points and see how the data line up with our ground rules.
Test #1: Does the wobble direction align with the expected slip direction?
First, what direction do the wobbles have, compared with the expected slip directions? Well, let’s look again at Figure 3c from the paper, which highlights mainland Japan.
The wobble motions are clearly aligned precisely East-West (with some noise). This is tectonically OK for central/north Honshu, but isn’t what we expect for Hokkaido or western Honshu. What about farther south, toward Ryuku? We can grab some screenshots (Figure 10) from a supplemental movie:

Sites above the Ryuku slab also move East-West, instead of the expected Northwest-Southeast direction. Notably, the vector far offshore mainland Japan, representing several sites in the Izu-Bonin Islands, also moves East-West in concert with the wobble on mainland Japan (more on that in a moment).
So, there seems to be strong disagreement between the direction of the wobbles and the expected tectonic motion direction, over most of the wobbly area. This should already be a major warning sign that the signal is likely not tectonic.
Tests #2: Does the spatial extent of the wobble match the tectonic interpretation?
The authors give their interpretation of the extent of sites affected by the ‘wobble’ in their Extended Data Figure 7, using GPS data from the geodesy group at the University of Nevada at Reno (UNR) (reproduced as our Figure 11). These GPS time series are similar to the Japanese Geonet time series (in Japan, the data are actually from the same monuments), although the processing strategy is a bit different. We can see that sites as far away as Manila, Hong Kong, South Korea, the southern Bonin Islands south of Japan, and Kamchatka are all identified as affected by the ‘wobble’.
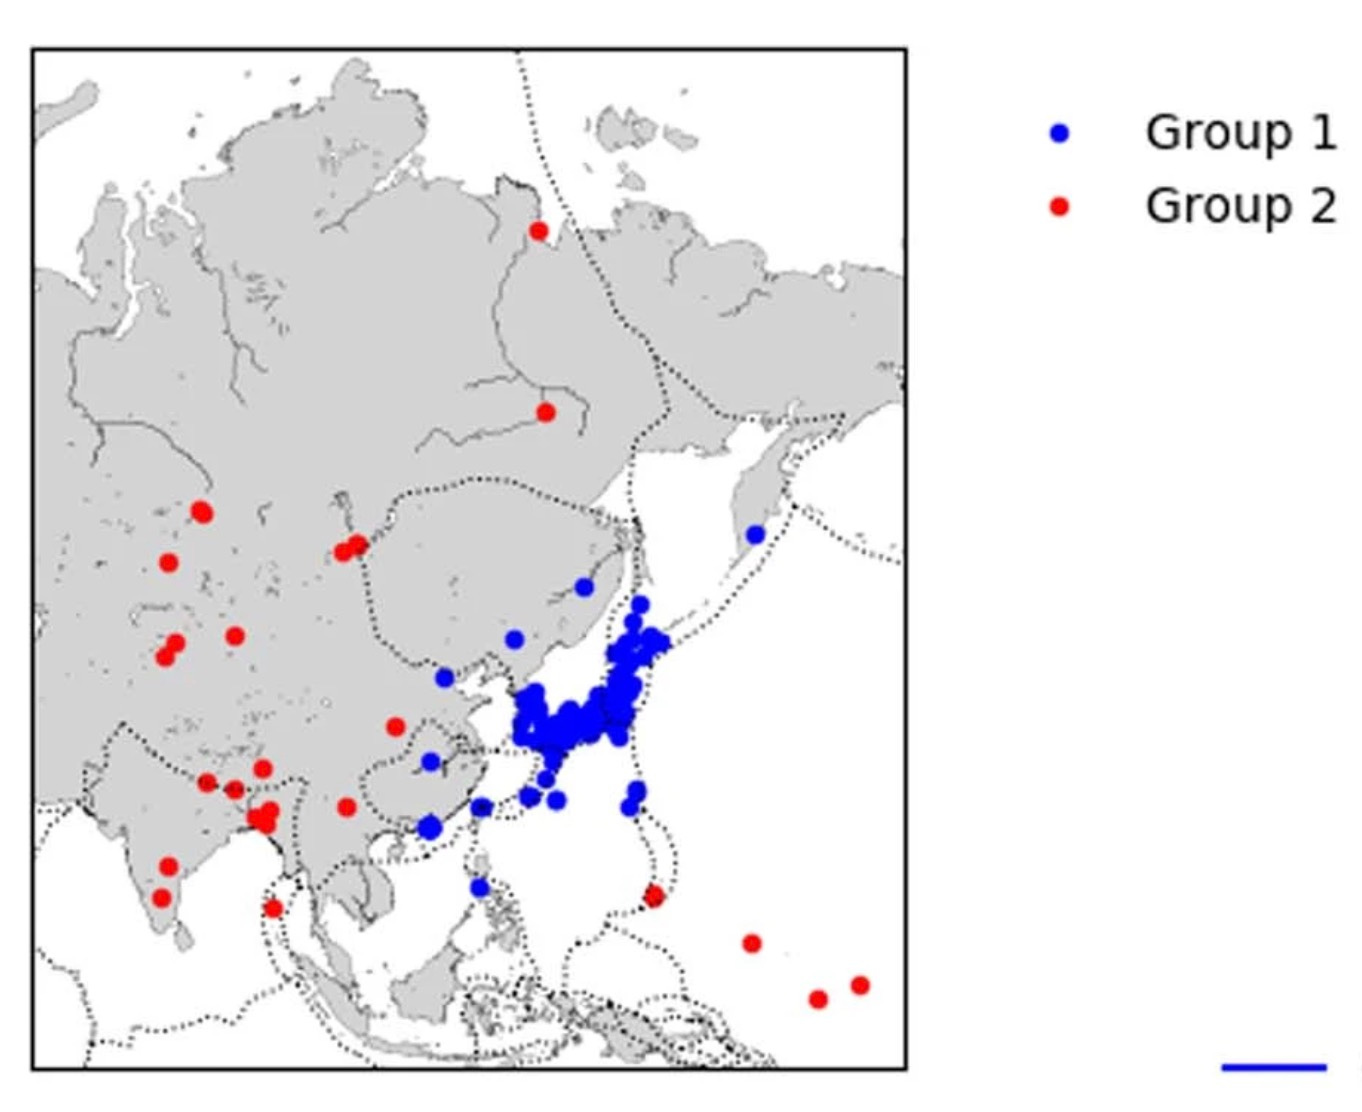
We examined the UNR time series data ourselves, and we think we can pretty confidently extend the ‘wobble’ behaviour even farther southeast, to sites in Guam and even Betio Island in Kiribati (1°21'18.0"N 172°55'22.8"E). The following Supplementary movie from the paper shows binned averages of sites, which are a bit hard to interpret far from Japan, where sites are not very dense. However, you can still see the wobble at low latitudes in the west Pacific Ocean, north of Papua New Guinea.
Video 2: Supplemental video (filename 41586_2020_2212_MOESM7_ESM.mp4) of Bedford et al. (2020), showing residual motions after detrending of UNR GPS time series.
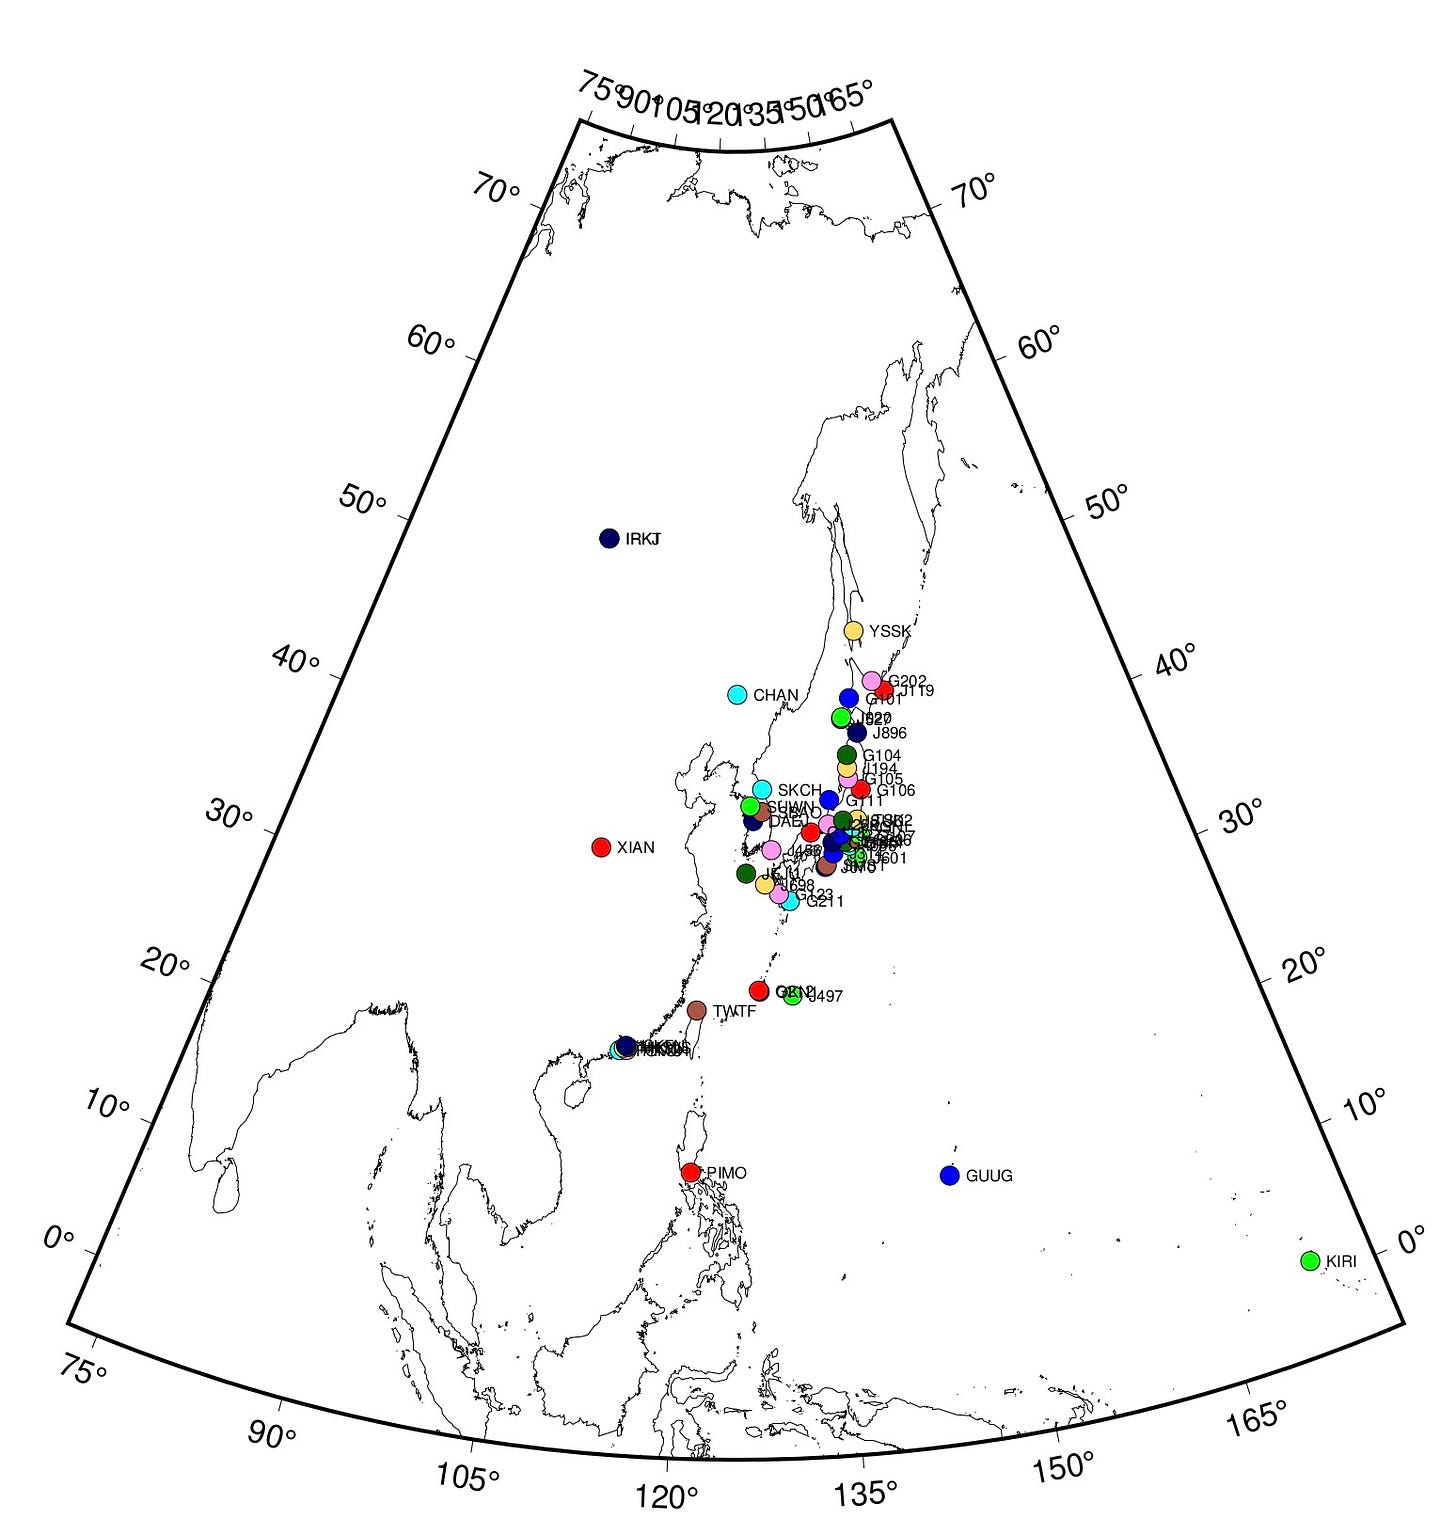
To more clearly show why we think the wobble signal exists at these far-field sites, we plotted detrended time series data (East component) of a subset of the UNR sites, shown on the following map (Figure 12).
The basic idea is to scroll through the REALLY LONG Figure 13 below. The sites are arranged in order from North (top) to South (bottom), and the colors match the map above. Look closely at the end of the time series, inside the box at the right hand side. This is the period of 2010 when the wobbling in Japan really gets going. In the UNR data, the ‘wobble’ is expressed as a bump or plateau (Eastward displacement), followed by a steep drop-off that does not recover by the end of the time series.

The sites at the very bottom of Figure 13 (HKWS, PIMO, GUUG, KIRI) show a change in the East component during late 2010 just as clearly as the sites identified as having the wobble in Figure 11. PIMO is in the Philippines, and is located above an entirely different, and oppositely dipping, slab (the Manila slab). GUUG is in Guam, right next door to the Mariana Trench. Betio (KIRI) is located 1,700 km away from ANY subduction zone; the closest slab is at the Solomon Islands. In our opinion, the provided data do not show any clear evidence for a region of the west Pacific that is unaffected by the late 2010 ‘wobble’ signal.
It is difficult to envision a physical process that could coherently move sites located so far apart from each other, across such different geological settings. Even the sites located closer to Japan, such as in South Korea, are too far away to be affected by shallow megathrust slip, which can only really move sites located within ~100 km of the slipping patch; certainly, the sites in mainland China are too far away to see this effect.
The GPS data therefore seem to fail both test 1 and test 2. This indicates to us that the origin of the apparent coherent motion in the GPS network is likely not tectonic.
In addition, we note that the entire process is seemingly aseismic, aside from the final initiation of foreshocks. One would expect that if the entire megathrust were undergoing slow slip - especially in Japan, where dense seismic networks can identify low-magnitude events - that the slip on the fault would result in correlated seismicity. Significant extension within the slab should also trigger extensional seismicity between the shallow and deep slabs. The lack of such seismicity is very surprising for a tectonic process of this scale.
Is there a different, non-tectonic explanation for the origin of the wobbles? In the next section, we take a closer look at the GPS data.
3. A closer look at wobbly GPS data in Japan
GPS time series contain basically two types of information: the actual coordinate position of the monument over time (for which there is a true, if poorly known, value), plus additional noise or bias that affects the position estimate but does not reflect the real position. For the purpose of this post, we will simply refer to this noise or bias collectively as error.
Raw GPS time series have to be carefully processed to remove known sources of error, such as shifts due to antenna changes, incorrect estimates of the orbits of the GPS satellites, or varying content of water in the troposphere, before the corrected data can be interpreted as real ground motion.
For most applications, it is also important to remove known or estimated ground motions that are not of interest to the current study. An example is the widespread, long-lived deformation that occurs following large earthquakes (called postseismic deformation). This process causes real motion of GPS stations that can be much larger than other signals of interest, and therefore needs to be removed if those other signals are to be interpreted. Other examples of real, but not tectonically interesting, motions are loading and unloading of the crust due to seasonal changes in water content of the surface and soils, the effects of tidal loading, and subsidence caused by groundwater extraction.
The only way to remove these types of signals without introducing new error into the time series is to subtract a perfectly known 3D representation of that deformation at each time step. However, most of these effects are usually measured using the GPS observations. So we have to live with the idea that it is usually impossible to completely remove these effects from the data.
There are many different approaches to removing error from GPS time series, each with its own virtues and drawbacks. The most critical issue is that the success or failure of the error removal needs to be carefully evaluated; otherwise, it is possible that the error "removal" process actually adds new bias or error into the time series. In some cases, the remaining errors may even appear to look like geological signals. When studies focus on processes that occur near the limit of detectability, it is especially critical that the chain of effects of the processing from raw data to final interpreted data is clear.
Here, we will examine both the raw (uncorrected by Bedford et al., 2020) and corrected GPS time series data, which are provided by the authors in their supplementary information.
We would like to note that the authors of Bedford et al. (2020) have done an excellent job in both providing the relevant data for their paper and clearly describing their workflow. This allows us to follow the logic of the paper carefully and make our own plots. It is critical that studies continue to provide open access to data and code, to allow this kind of careful critical analysis.
To get an idea of the data at hand, let’s focus on only three GPS stations widely distributed across Japan. First, we plot the processed (final) data for the period beginning in June 2010, before the wobbles really begin (Figure 14). These time series have been treated to remove noise and seasonal variations using the authors’ automated routine (called GrAtSiD), and have also been ‘detrended’ to remove an average motion. The smooth wobbles are clearly visible, especially in the East component. The peak of the East-directed wobble occurs earlier at Kitadaitou than at Kitamiesashi or Tsukuba1; this is the progressive northward onset of wobbling that is noted in the paper (our Figure 6). The fact that the wobbles mainly show up in the East component is consistent with our analysis above of the generally East-West motions. For the moment, ignore the dashed vertical lines and dates; all will become clear in the next paragraph.

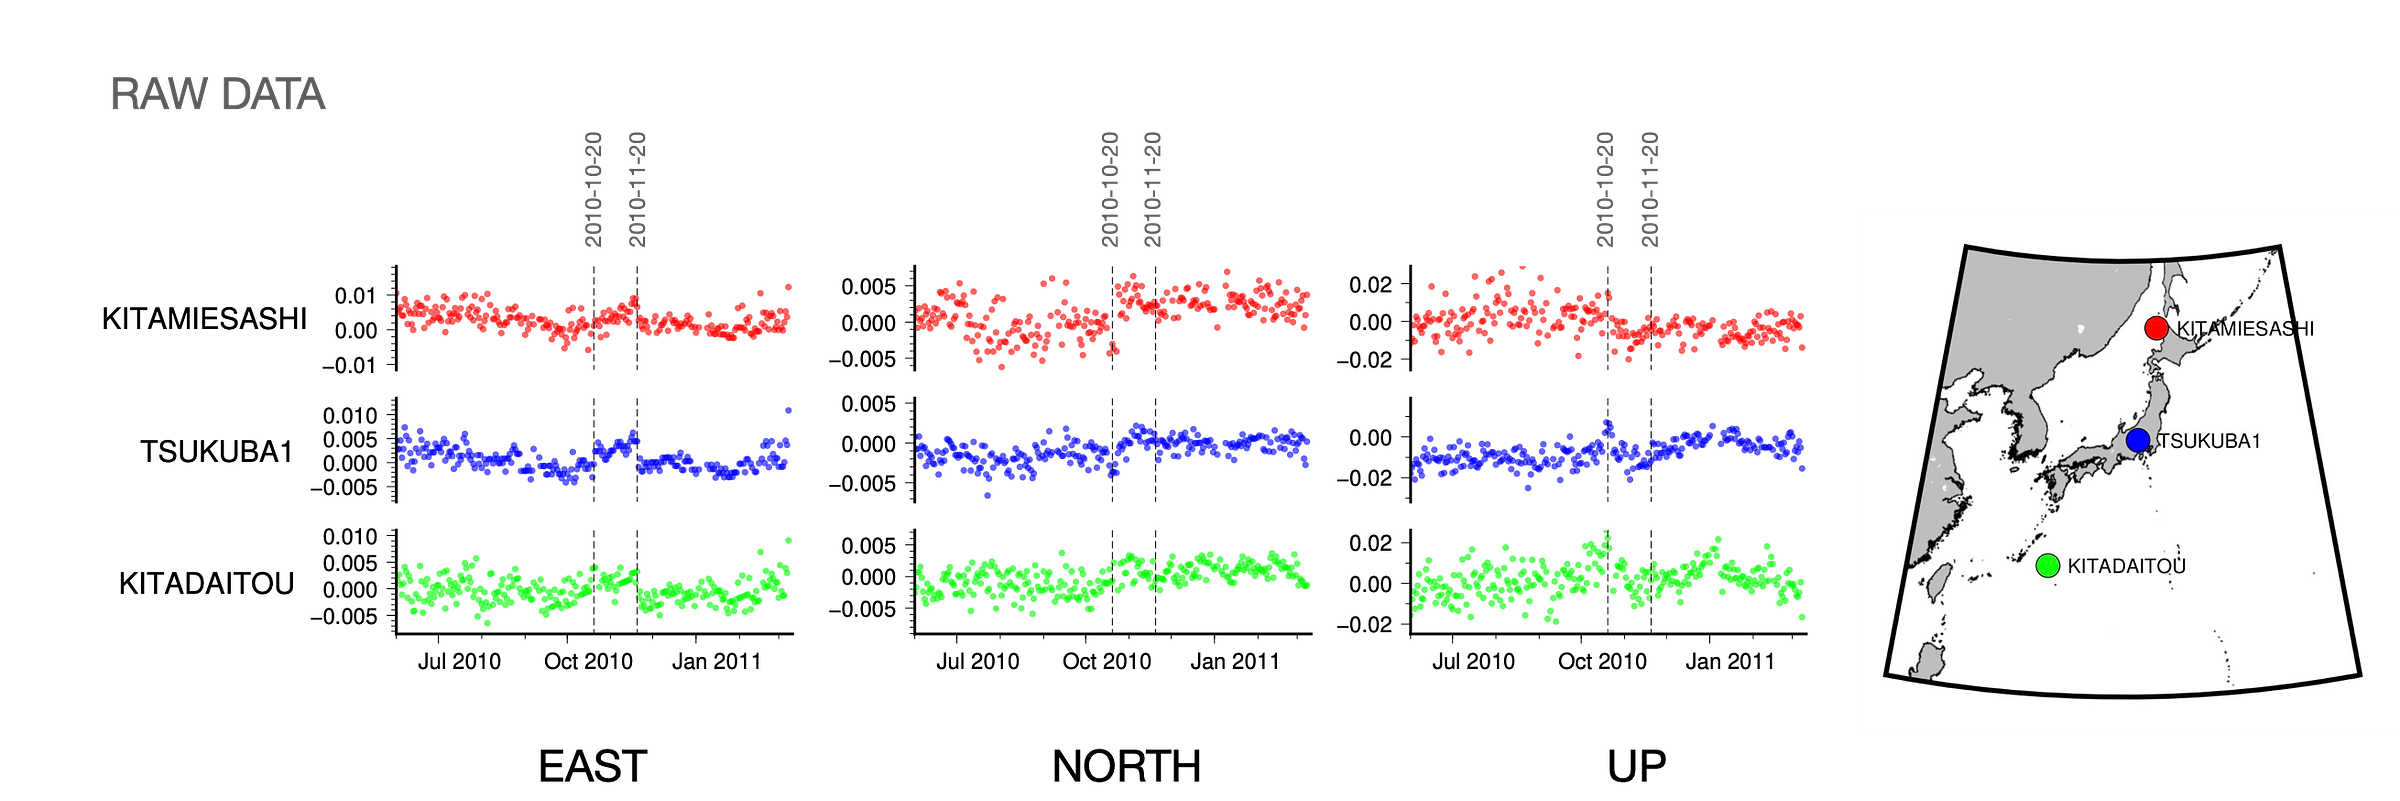
Now, let’s plot the raw time series data for the same sites (Figure 15). These data have not been corrected in any way, only detrended. It seems obvious to us that the time series are interrupted by step changes in position, which occur simultaneously in the different components (North, East, Up) but have different magnitudes in different directions. These are called ‘jumps’, and are common in GPS time series. The origin of some jumps is well known, as in the case of antenna replacements or equipment failures, but many jumps remain unexplained and are likely due to complications of the GPS location method itself. Jumps like this are routinely removed, either manually or using some kind of detection and correction algorithm, before time series are analysed. In the time series below, we manually identified two jumps in 2010, on October 20 and November 20.
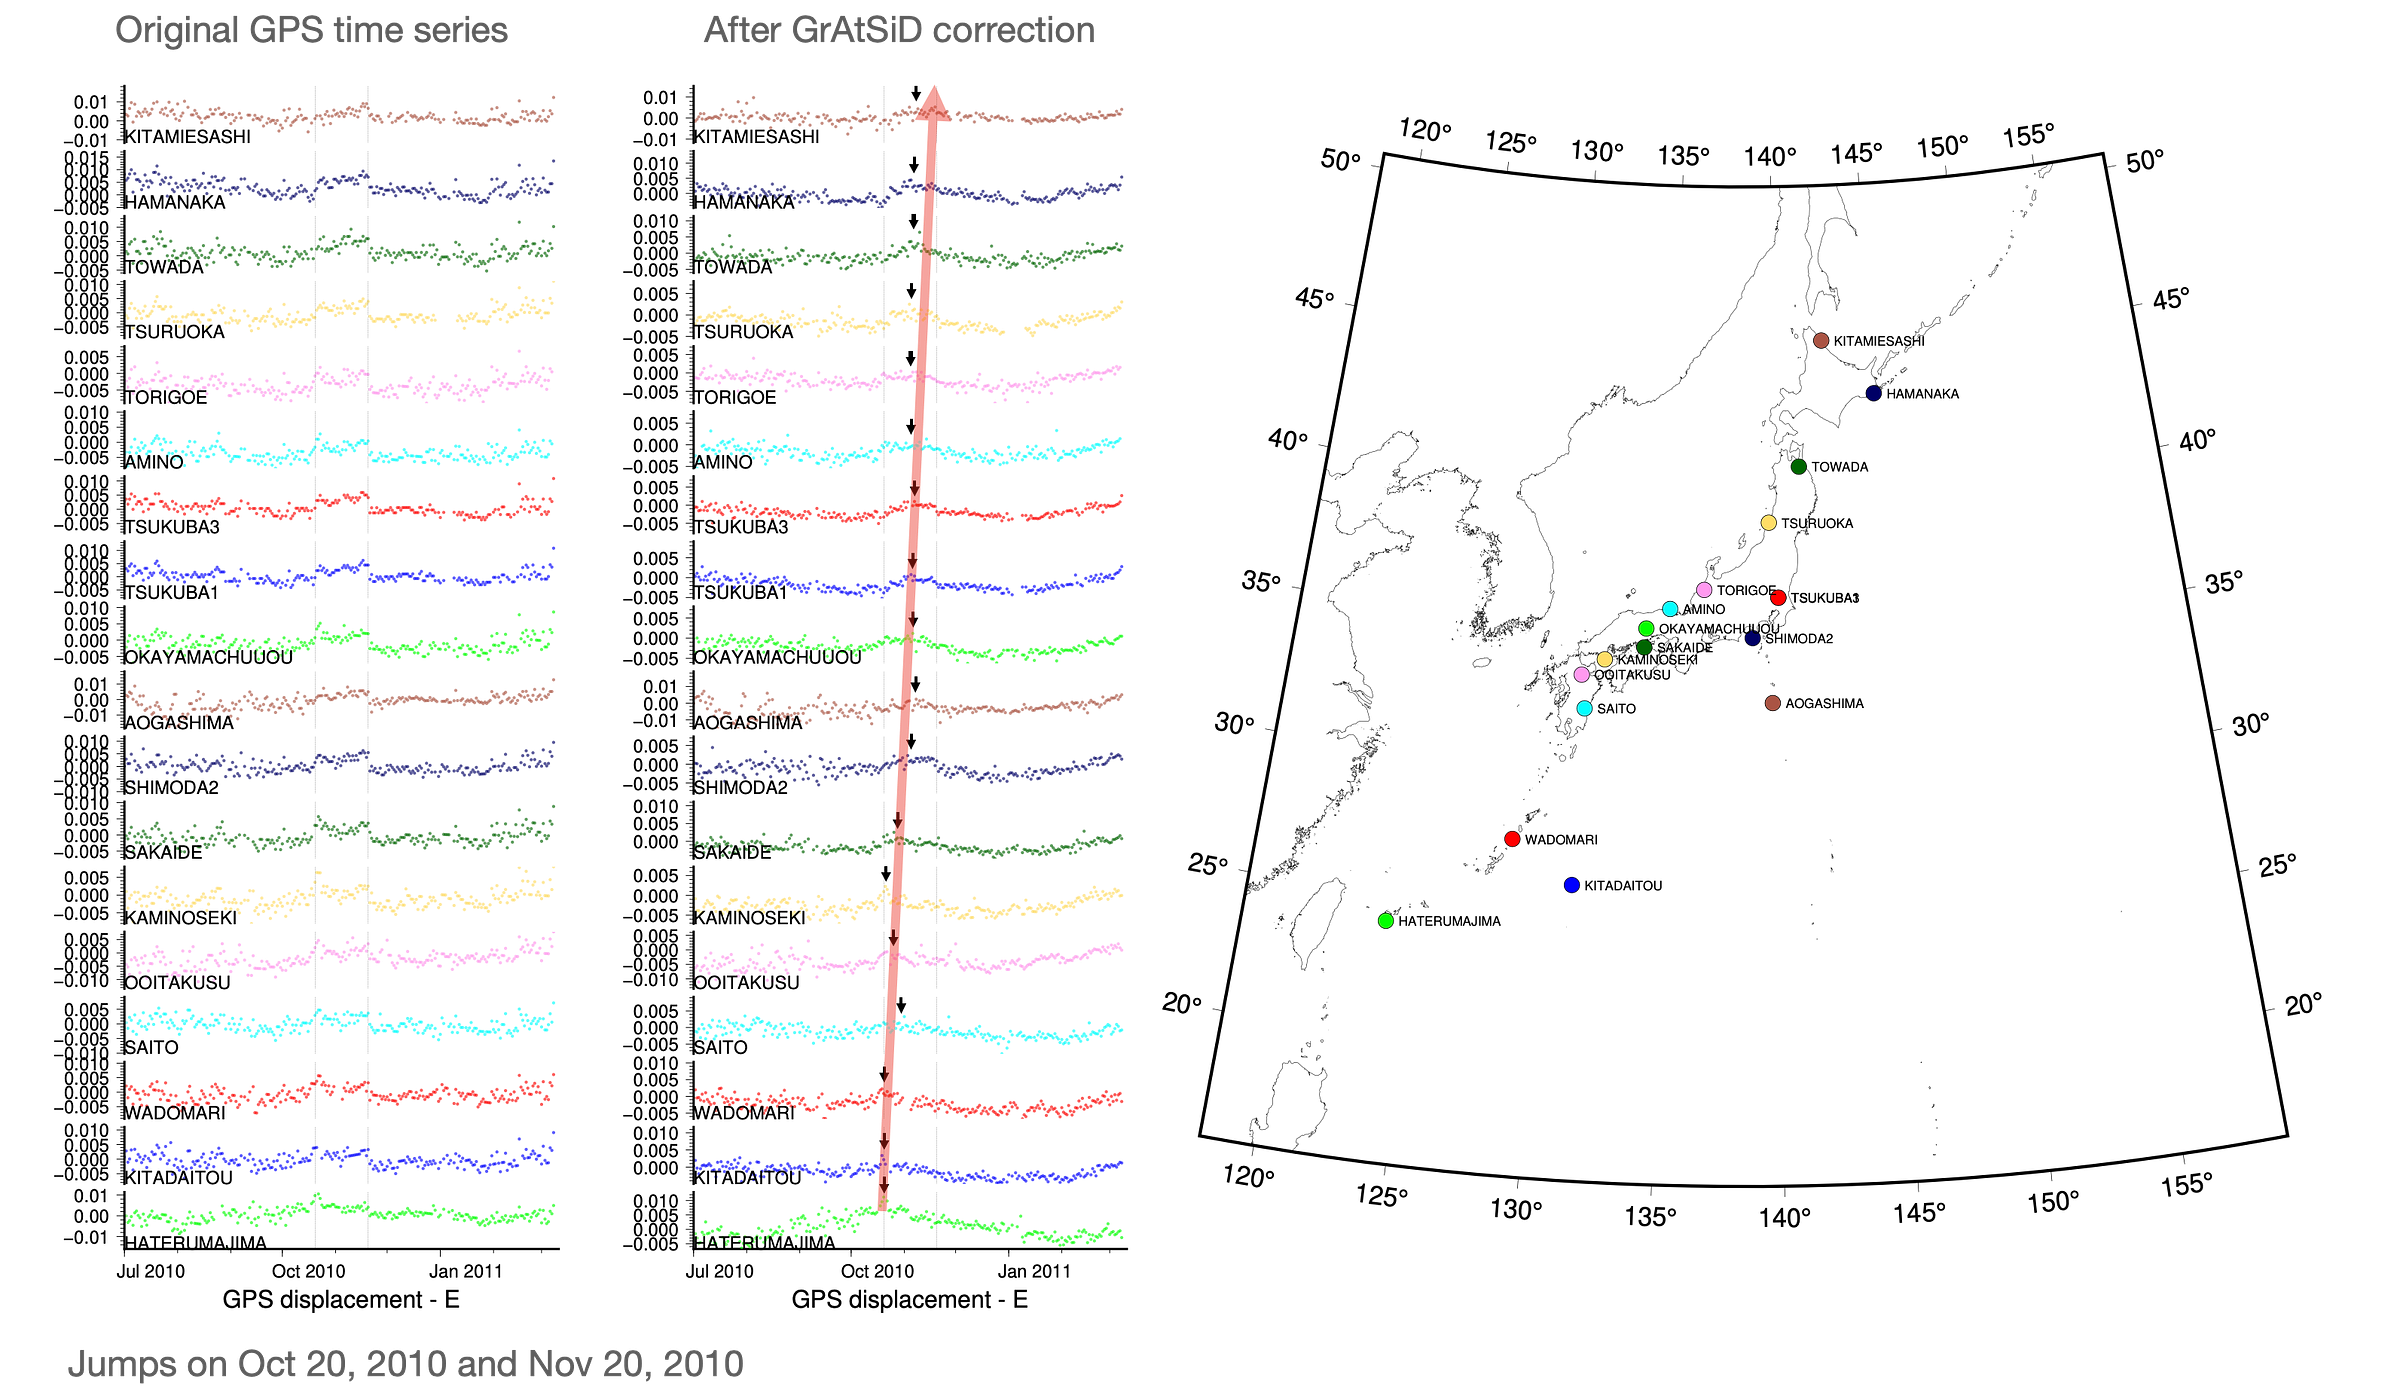
How many of the GPS stations in Japan experienced these two jumps? We plotted the East component of 18 randomly selected stations of the 1,409 available stations (Figure 16). Well, we actually plotted all 1,409 stations, but the figure was a bit too tall at that point. The raw data is the left-hand panel, and the final data is the right-hand panel. It should be clear that the jumps are simultaneous across the entire network. In contrast, the wobbles do not line up perfectly. The black arrows in the final data indicate the visually estimated peak of each wobble; the red arrow highlights the general northward progression of the wobbles over time.
One quick way of testing whether the jumps are the same at all stations is to just subtract one time series from all of the rest. This effectively turns the subtracted site into a fixed reference point, and basically should remove any shared motion. We arbitrarily chose the site at Sakaide as our reference (Figure 17).

The jumps in all components at these three sites are either completely removed or significantly reduced. This holds up pretty well for the rest of the sites in the network; below, we plot the East component only (Figure 18), allowing comparison with Figure 16.
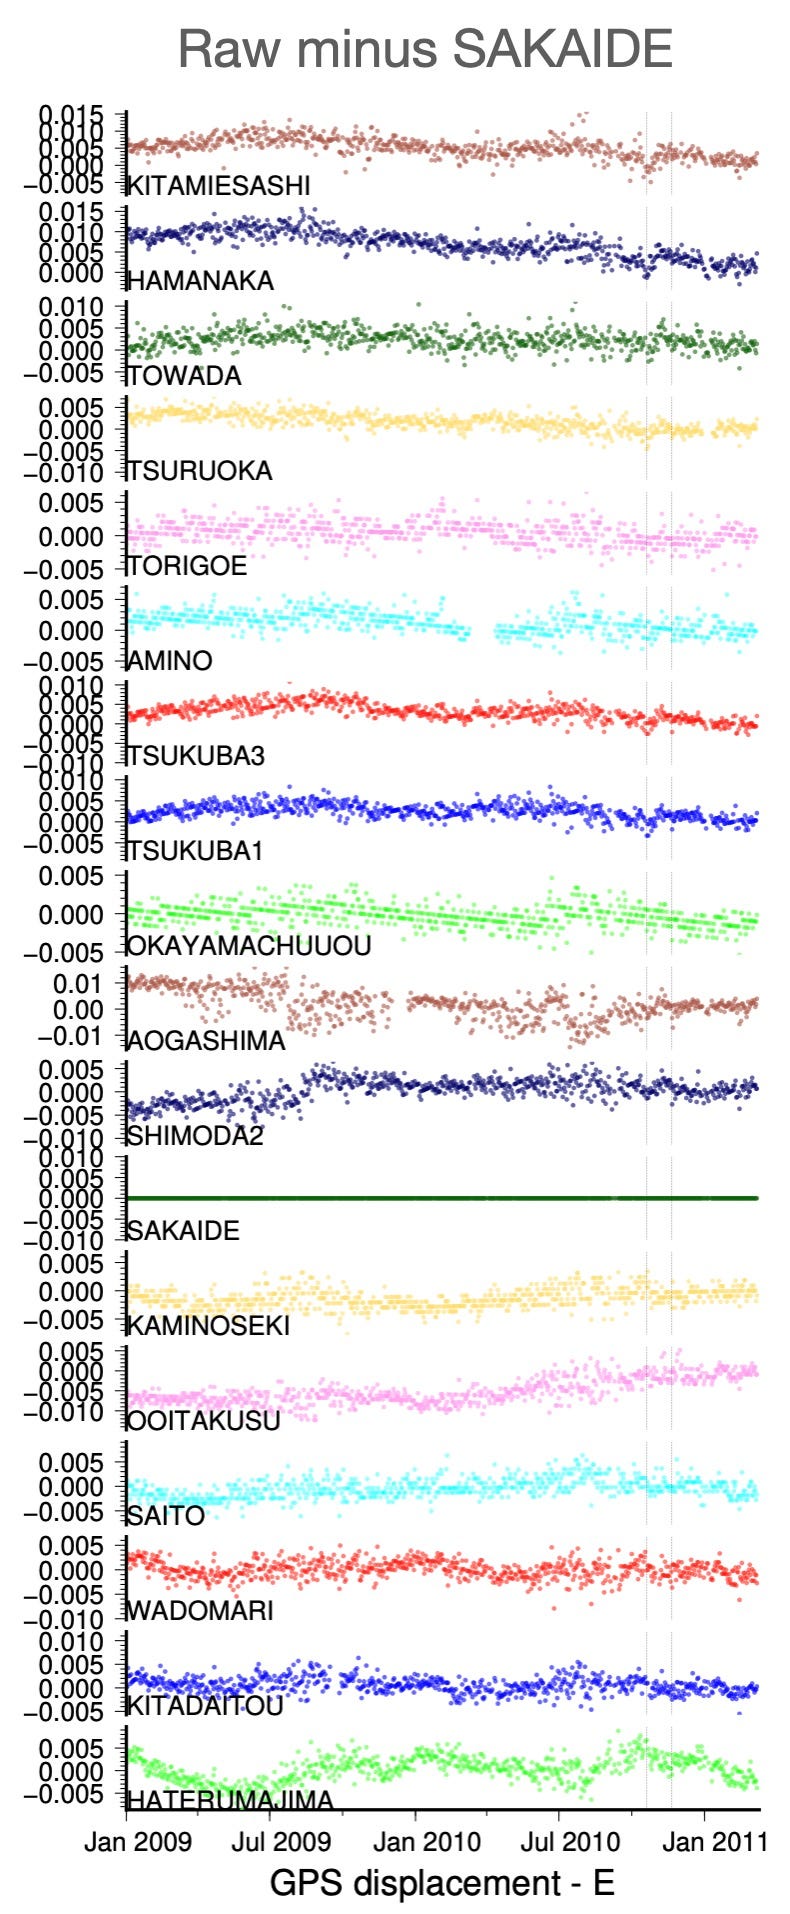
The point of this exercise is simply to demonstrate that the jumps seem to be network-wide, simultaneous, and have similar amplitudes in each time series. These properties are very important in terms of how we can interpret the signal. In our opinion, there is no possible physical process that can actually shift all of Japan sideways and up/down uniformly and simultaneously over a 24 hour period. In contrast, there are many ways that GPS errors can be distributed across a network and be both simultaneous and uniform. In fact, there is a very well known explanation for this kind of effect in the Geonet F3 GPS data from Japan, which were the data used in this study. Figure 19 is an excerpt of a paper on Geonet’s processing methods.

The Geonet F3 data are determined using something called a ‘baseline’ method. At each point in time, the location of the GPS monument Tsukuba1 was determined by reference to IGS GPS stations surrounding Japan. All other Geonet stations are then referenced to Tsukuba1. This approach allows each station to be placed into a global (IGS) reference frame - very useful for many GPS applications. However, it also means that the motion of Tsukuba1, real or error, is directly propagated to every Geonet F3 site in Japan - which is the data used in this paper. A description of this approach was presented at a conference in 2016 (Figure 20):
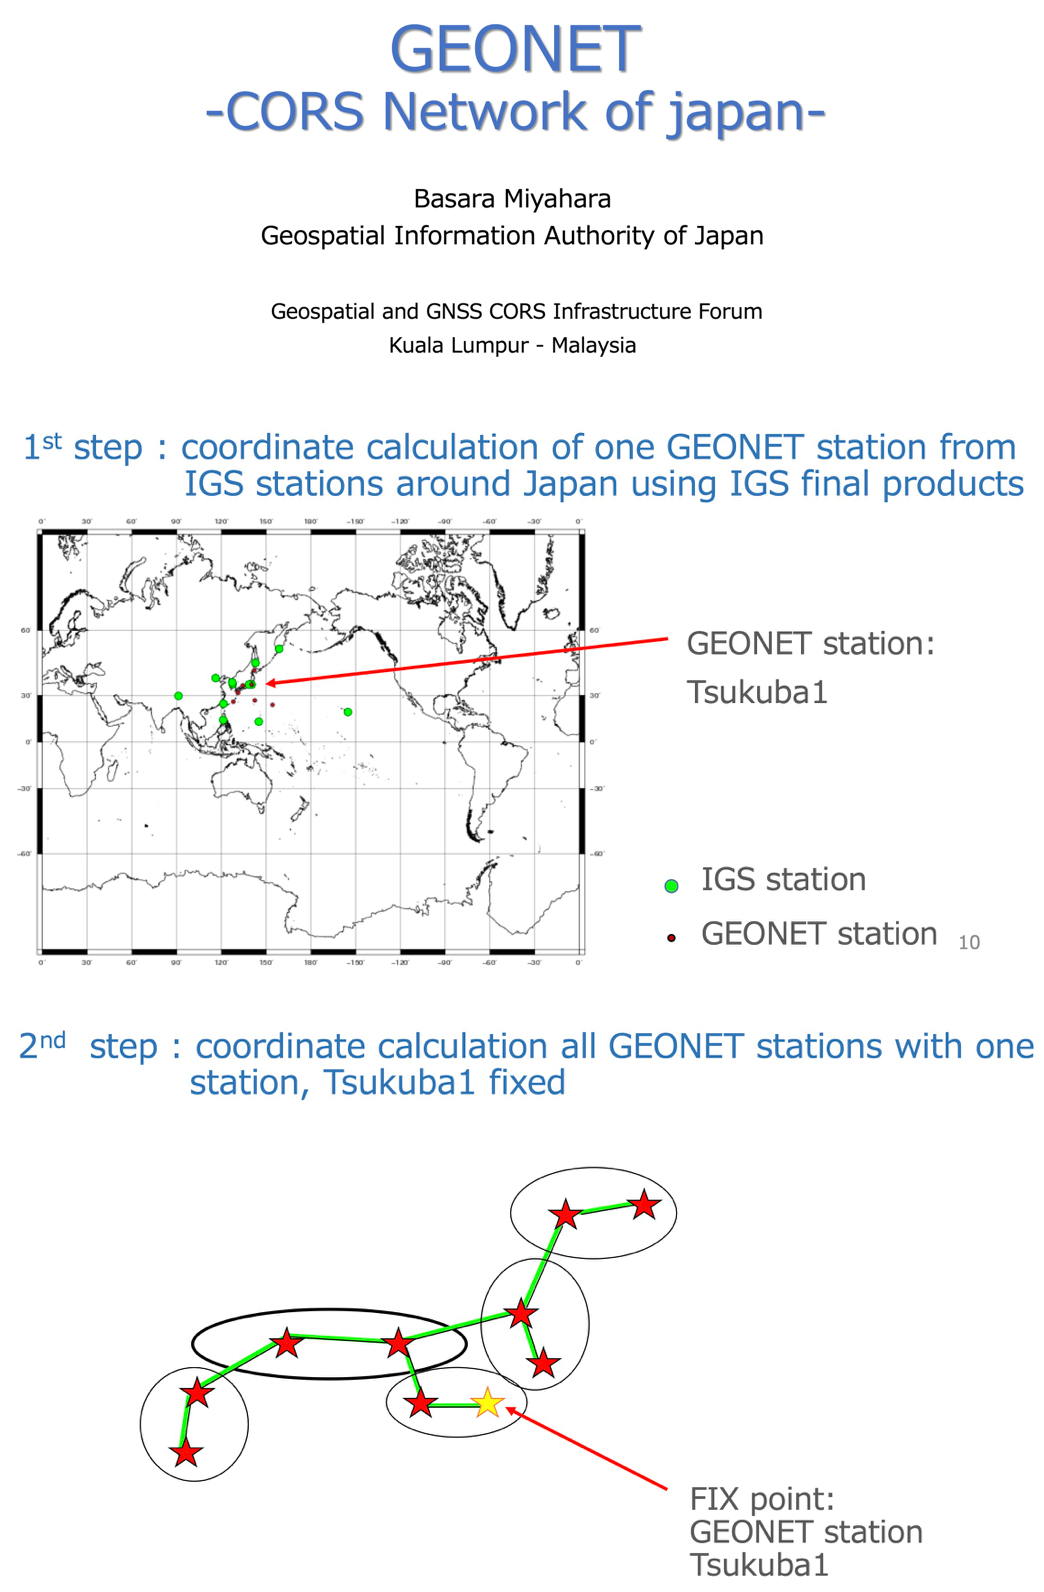
This approach works well, except for when one or more of the IGS reference stations experiences a problem. If, for instance, an albatross dropped a fish onto an antenna at an IGS GPS site in Guam (note that we are not actually aware of an actual fish-dropping source of GPS error), causing the site to go temporarily out of service, the Guam data would abruptly disappear, and no longer used to locate Tsukuba1. This would cause an immediate shift in the position solution, and the inferred location of the site. If this shift were only ~5 mm, few people would really notice it. However, for studies that use only the residual GPS velocities after removing average trends, this is a pretty big shift - as large as the proposed wobble signal, for instance. That shift would then be propagated to all Geonet F3 sites in Japan. When the IGS site became operational once again, another small jump would likely occur. Notably, in this hypothetical scenario nothing happened in ANY site in Japan to cause the jump, and yet each site’s time series would contain the jump.
This problem with the baseline method is one of the main motivations for Geonet’s recent move to a new processing strategy, called F5.
We do not personally know the exact approach that Geonet used to reference sites to the Tsukuba1 baseline station. However, they cannot simply subtract the Tsukuba1 displacement like we did above; instead, there is probably a more complex process that involves rotation of the reference frame. This could mean that sites farther from Tsukuba1 would experience a different correction than sites close to Tsukuba1, which would probably result in different sizes of jumps at far-away vs nearby stations. We can’t really dig into this ourselves, and feedback from experts on this point is highly interesting to us!
We do not yet know, and may never know, the specific cause of the jumps on or around October 20 and November 20, 2010. However, we are confident that the jumps exist in the raw data, during the period when the biggest wobble is interpreted across the Geonet network.
So, the next step is to see if we can understand how the noise correction method of Bedford et al. (2020) seems to turn these simultaneous jumps into smooth, migrating wobbles.
4. A closer look at the GrAtSiD method
The authors apply a new curve-fitting algorithm to the GPS time series called Greedy Automatic Signal Decomposition, or GrAtSiD. (Easy to say, not so easy to type!) The idea behind this method is that the source of signal in GPS time series often cannot be fully known independently, but the time series can still be fit using a few kinds of simple mathematical functions, like exponentials.
These kinds of functions are commonly used to understand some types of tectonic signals, like postseismic displacements. Geodesists and seismologists can analyze the “transient” signals caused by postseismic creep and other tectonic motions, and then remove them so that they don’t bias interpretations of long-term crustal movement. In other words, these functions usually represent some kind of physical, controlling process.
Manual analysis of these transient signals is slow, and with tens of thousands of continuous GPS stations around the world, there are more and more time series to analyze each year. Enter GrAtSiD, a new approach to automatically solving this problem. The method was introduced in 2018 in a paper published by a subset of the same authors (Bedford and Bevis, 2018) as the newer wobble paper (Bedford et al., 2020).
GrAtSiD is basically saying: Let’s try to fit the time series data piece by piece with generic mathematical curves, rather than assuming a-priori that we know what the physical process is. Then, we can interpret the curves on the basis of what we know about tectonics and seasonal changes. It’s an empirical method that is trying to objectively fit the data, and it is model-agnostic. The power of this approach is that it may be able to discover previously unknown signals in data.
Because there are various ways that data can be fit by curves, GrAtSiD is run in several steps, with each interation trying to fit the data and then assessing the difference between the data and the fit. There is a trade-off between how many functions are used and how good the fit is. Figure 21 is from the 2018 GrAtSid paper:
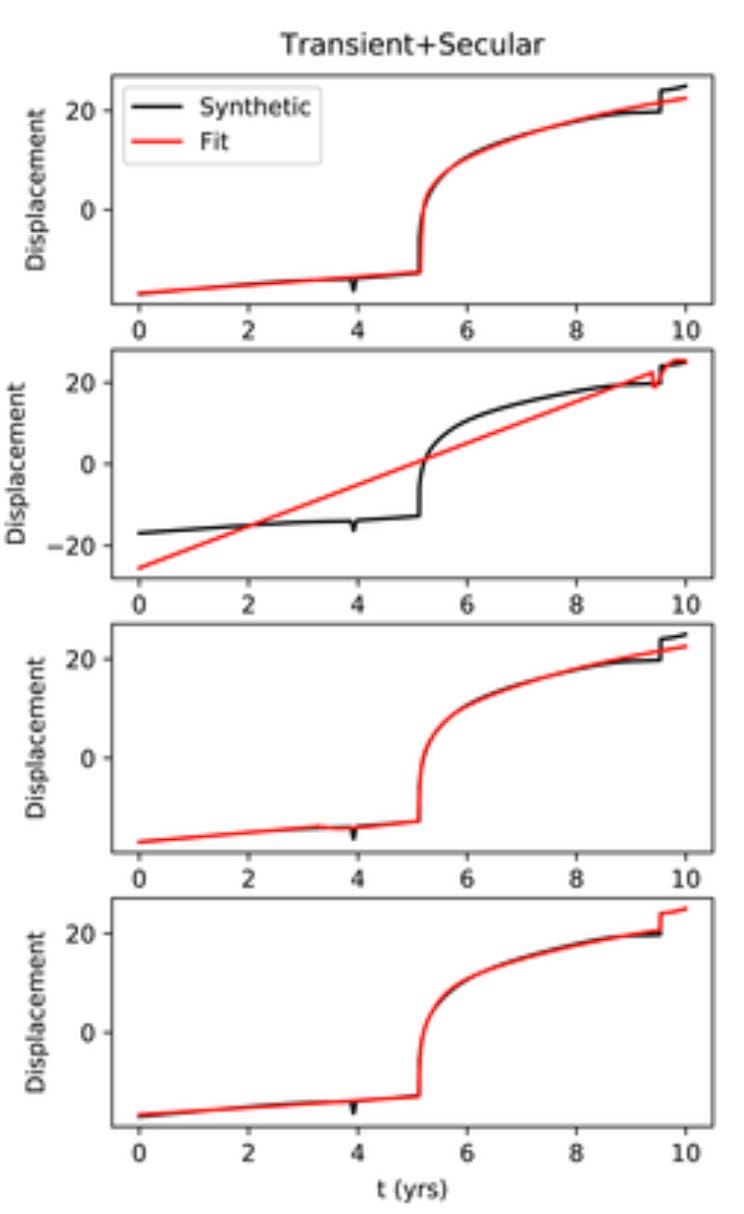
In Bedford et al. (2020), the authors ran the GrAtSiD code on their time series. One of the things they found is that after the first run of the code, the difference between the curves and the data was similar across all of the stations in Japan. They concluded that there was a “jitter” of the reference frame - that the whole reference frame was moving a little bit from day to day (this makes a lot of sense given the Geonet F3 baseline approach, described above). Since this jitter adds noise to the time series, they wanted to remove it. But how?
They decided to estimate the jitter by fitting each of the time series using a single run of GrAtSiD, calculating the difference between the fit and the data at each station, and then finding the median of the difference across all of the stations at each time interval. This allowed them to create a new time series, representing the average “jitter” across all of the time stations. Because this jitter is common across all of their stations, they refer to it as the “common-mode noise.” By subtracting it out, the scatter of the data became smaller - it appeared that the signal-to-noise ratio was improved. This seems like a reasonable way to manage the coherent error in the F3 dataset (such as the simultaneous jumps described in the previous section).
HOWEVER…
It seems like the first run of the GrAtSiD algorithm did not discover the jumps on October 20 and November 20, 2010. This is not unexpected: the figure above shows that it can take several iterations of the algorithm to reliably find all of the jumps. The jumps on those dates are also small compared to the data scatter, and easy to miss.
What we think happened:
Network-wide jumps exist around October 20 and November 20, 2010 in the raw time series data for Japan. These were not removed manually, but could have been justifiably removed based on prior understanding of how F3 data contain simultaneous errors including jumps. Other jumps in the datasets were removed, including manual removal of jumps in the Maule data and automatic GrAtSiD removal of jumps in both datasets.
The initial GrAtSiD fit did not identify these jumps as steps, instead fitting some kind of unknown but likely continuous curve through the jumpy data.
The median deviation of the raw data from these fitted curves was calculated as the “common mode noise”. This noise is a deviation from the smooth fits, and so removing it does not fully correct for the jumps. Instead, it effectively smooths across the jumps while also correcting for a remaining sharp offset in the data just around the precise jump time.
After subtracting the noise from the time series data, the sharp jumps disappear and are replaced by smooth wobbles. Subsequent GrAtSiD fits to the corrected time series cannot recover from the baked-in, but now smooth, jumps.
In Figure 22 below, the left-hand panels illustrate the progression from raw data to smooth wobbles, using only data directly taken from the supplementary information. The panels show the raw data (top), estimated noise (middle), and raw data minus the noise (bottom). From a stepped time series arises a wobbly time series.
The panels at right show two alternative approaches to removing the jumps from the raw time series data - they are our product, not from Bedford et al. (2020). The middle right panel shows the effect of simply subtracting the Tsukuba1 site from Sakaide; this is probably not a great way to de-jump the data. The lower right panel shows the effect of a manual correction to the time series, where 5 mm of East displacement is subtracted from the time series between October 20, 2010 and November 20, 2010. This is similar to the automatic GrAtSid method that is applied when jumps are identified.
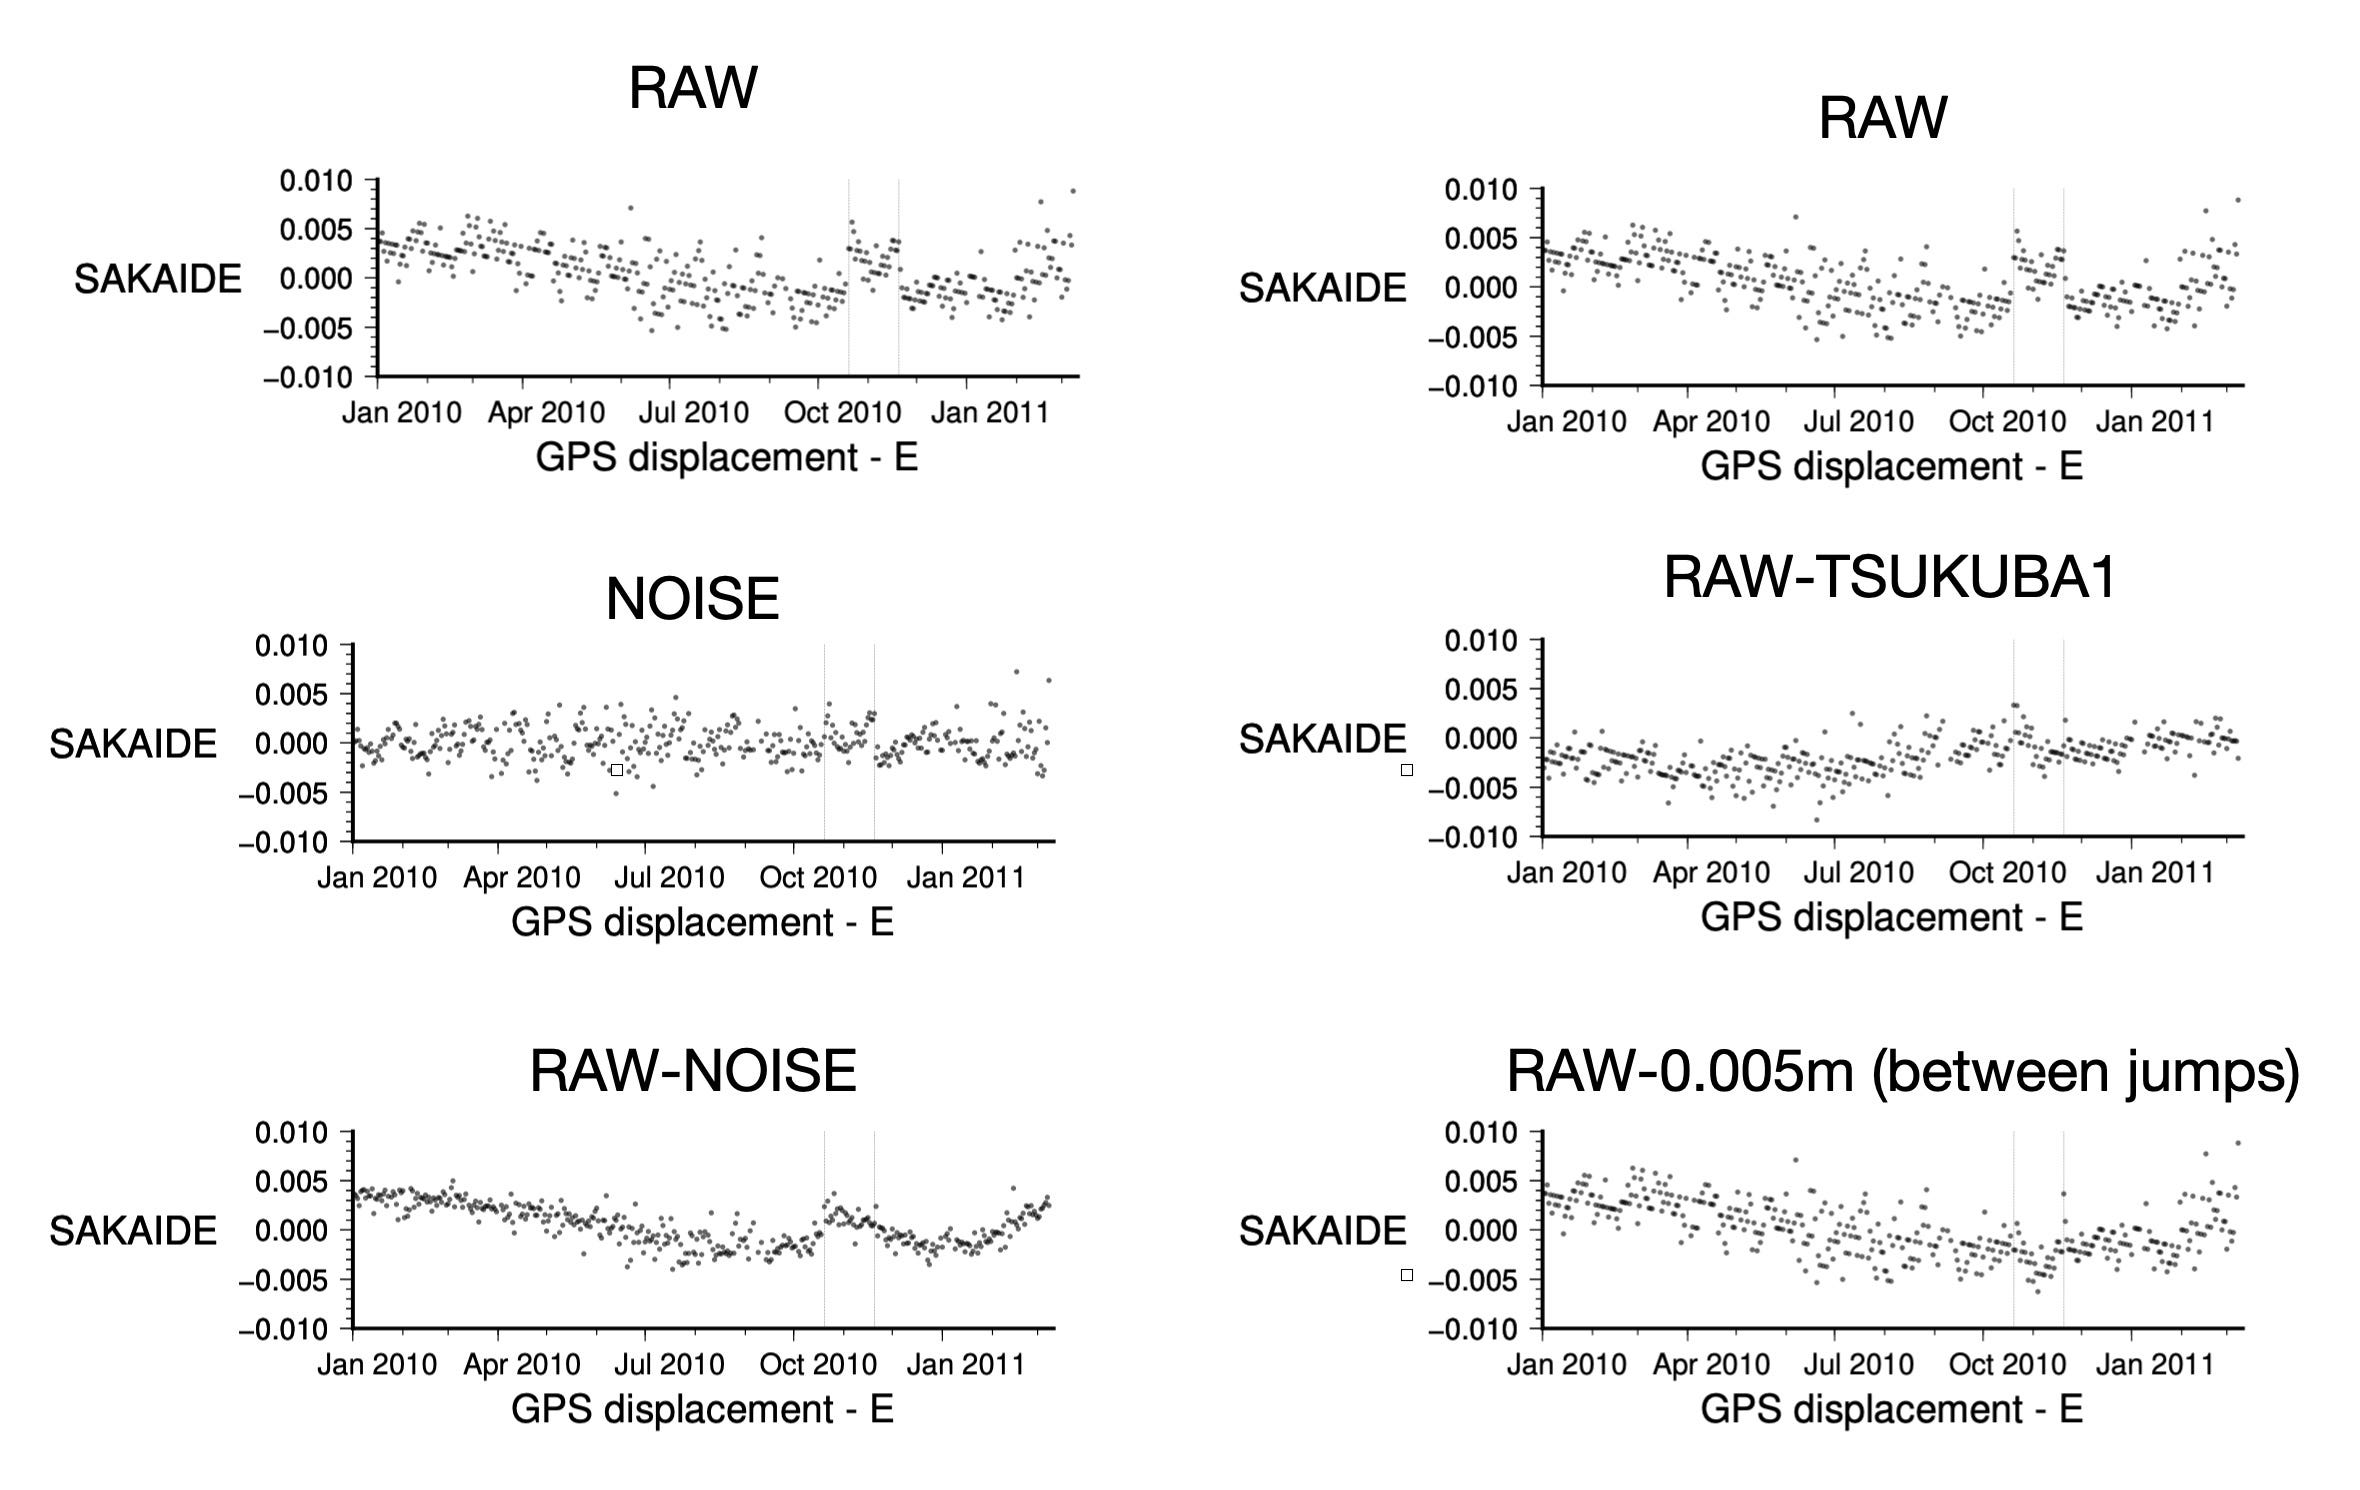
It looks like the wobbles originate as jumps. Because the jumps can be clearly interpreted as non-physical, the wobbles are also probably non-physical.
Critically, the East-West motion of the wobbles likely derives from the simple fact that the East component experienced the biggest jumps. This is not really unusual from a GPS perspective, as the East component is less reliable than the North component.
5. Our take-aways
Based on our reading of Bedford et al. (2020), we believe that the proposed wobbles are not of tectonic origin. The critical points are:
The direction of the wobbles around Japan is inconsistent with expected tectonic motions along the related subduction zones.
The wobble-like signal is apparently visible at GPS sites very far away from any subduction zone, in the UNR time series.
The wobble signal in Japan can readily be explained as arising from network-correlated GPS jumps. This can explain both the East-West direction of wobbling and the presence of the signal at far-flung sites.
Plate tectonics is a tremendously predictive model. It provides us with strong tests. If we observe processes of deformation at the scale of plate boundaries that are not consistent with known plate motions, then we need to seriously question whether they are real or not. The lack of a physical forward model that can actually predict the crustal motions arising from competing slow slip and slab pull means that this paper never adequately tested their data against plate motions.
We note that slab-driven crustal wobbles have not been verified by any other direct observation. To our knowledge, no comparison has been made with other geodetic data such as tide gauges, VLBI, InSAR, repeat leveling surveys, or other independent measurements of crustal motion. We have also found no detailed analysis of the origin of GPS jumps in the west Pacific, probably because the jumps are small and the problem of jumps is already well known in the field of geodesy. We would be very interested in hearing from people who have better understanding of the details of these methods.
Because GPS measurements suffer from so many causes of noise and bias, subtle deformations that reveal apparently new Earth behaviors should be scrutinized very carefully.
So, are there giant wobbles before great earthquakes? We are not convinced.
Note: As usual, we would like to note that we are not subject matter experts in GPS data, and we may have misstated something or misinterpreted some technical aspect of that field. This post should be viewed not as a final conclusion, but rather as our personal attempt to really understand the origin of the wobble signal. This post will be permanently free on our Substack and we encourage open discussion of the paper and our analysis, either via comments (open to unpaid subscribers) or personally via email!
References
Bedford, J. and Bevis, M., 2018. Greedy automatic signal decomposition and its application to daily GPS time series. Journal of Geophysical Research: Solid Earth, 123(8), pp.6992-7003. https://doi.org/10.1029/2017JB014765.
Bedford, J.R., Moreno, M., Deng, Z., Oncken, O., Schurr, B., John, T., Báez, J.C. and Bevis, M., 2020. Months-long thousand-kilometre-scale wobbling before great subduction earthquakes. Nature, 580(7805), pp.628-635. https://doi.org/10.1038/s41586-020-2212-1.
Hubbard, J., Bradley, K., 2023. Did the High Atlas really grow 20 cm in the Moroccan earthquake? Earthquake Insights, https://doi.org/10.62481/9cb23fd9
Miyahara, B., 2016. GEONET CORS Network of Japan. Geospatial and GNSS CORS Infrastructure Forum, Kuala Lumpur, Malaysia, https://www.fig.net/resources/proceedings/2016/2016_10_AP_CDN/4.1_JapanModernisation.pdf
Takamatsu, N., Muramatsu, H., Abe, S., Hatanaka, Y., Furuya, T., Kakiage, Y., Ohashi, K., Kato, C., Ohno, K. and Kawamoto, S., 2023. New GEONET analysis strategy at GSI: daily coordinates of over 1300 GNSS CORS in Japan throughout the last quarter century. Earth, Planets and Space, 75(1), p.49. https://doi.org/10.1186/s40623-023-01787-7.
Didn’t get enough? Keep reading!
Read our previous analyses of recent high-impact papers about earthquakes. These posts are free to read (no paywall).


Hi Kyle and Judith, thanks for this =compelling and accessible forensic exploration of both the data and proposed underlying processes put forward by Bedford et al. (2020).
You mention a lack of comparison with other geodetic data. However, similar ideas have been put forward and discussed in a series of papers focused on anomalies in GRACE gravity in the months prior to the same earthquakes.
I also hope your post will stimulate more discussion and analysis.
Panet, I. et al (2018). https://doi.org/10.1038/s41561-018-0099-3
Wang, L., & Bürgmann, R. (2019). https://doi.org/10.1029/2019GL082682
Bouih, M. et al. (2022). https://doi.org/10.1016/j.epsl.2022.117465
Panet, I. et al. (2022). https://doi. org/10.1029/2022JB024542
Quite interesting, thanks for taking a close look and framing it wrt the regional tectonics.