Earthquake precursors? Not so fast.
Real, useful, or wishful thinking? Let's deep-dive the paper.
Citation: Bradley, K., Hubbard, J., 2023. Earthquake precursors? Not so fast. Earthquake Insights, https://doi.org/10.62481/310cc439
If this post has reverted to behind a paywall, download a pdf here. All of our analyses of recent research papers are intended to be permanently free to read and comment to allow open discussion by the scientific community.
A new paper published in Science looks at high-rate GPS data - recorded by stations that measure their locations on Earth many times per minute - to try to find signals of upcoming large earthquakes. The paper has made a splash because “earthquake prediction” is probably the hottest topic in seismology - long pursued, thus far fruitless, and now almost taboo. The field is now mostly associated with science mystics, a.k.a. quacks, who make “predictions” using planetary alignments or other hogwash. Luckily for us, the present study by respected geodesists (people who study how the form of the Earth moves) is looking at physical signals of the Earth that might actually have some kind of predictive power, at least over short timescales.
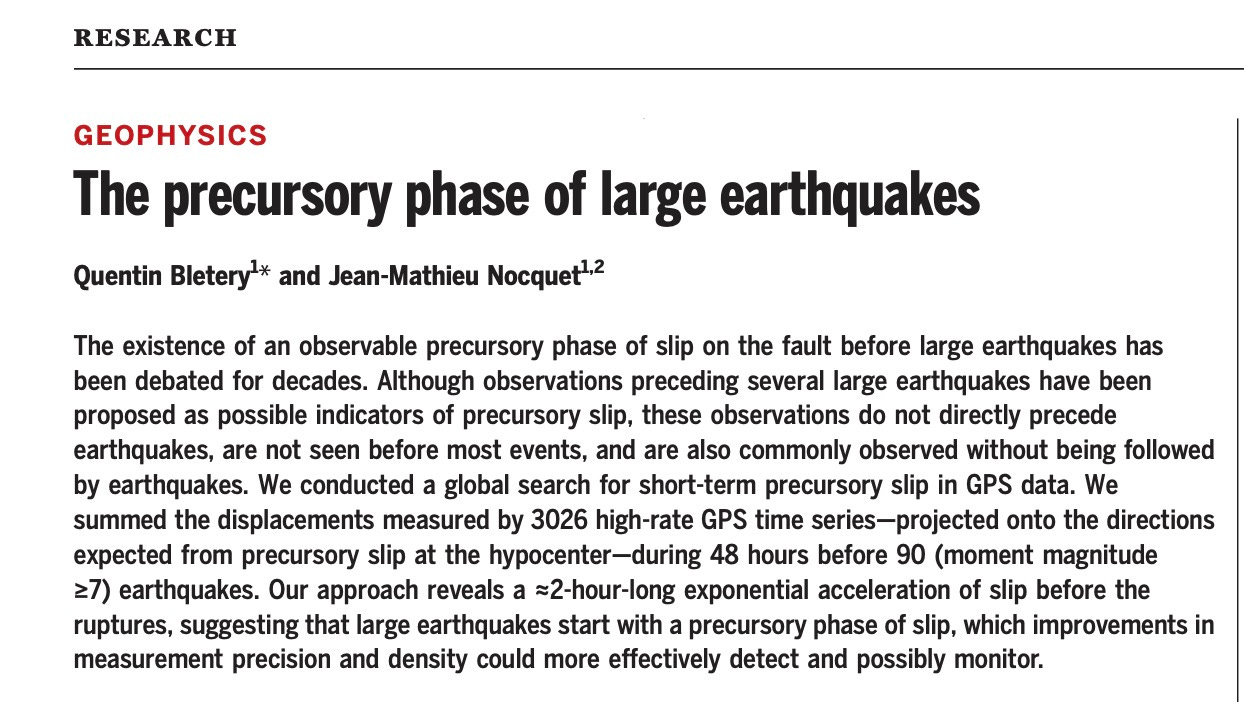
In a nutshell, the authors contend that while GPS data in any one region do not show clear earthquake precursors, if thousands of time series of data from the days before large earthquakes are stacked together in a specific way, there is a small signal that appears to arise about two hours before mainshock nucleation. This small signal is interpreted to represent motion aligned with the direction of slip of the upcoming earthquake - suggesting that a small patch of fault has started to move aseismically before the seismic rupture actually nucleates. Furthermore, they suggest that periodic signals in the GPS time series reflect unusual fault slip behavior. Early slip around the nucleation zone is a physically reasonable thing to expect, and happens in numerical models of earthquake nucleation. In fact we often observe precursory behavior before large earthquakes, usually in the form of foreshocks - we just don’t know that they are foreshocks until the mainshock arrives!
The study by Bletery and Nocquet relies on stacking many time series of data. A time series is simply a list of values over equal time intervals. Stacking time series is as simple as adding up all the values in the same time bin. In general, stacking can reveal systematic trends in noisy data by raising the signal-to-noise ratio. For this to happen, the noise in the data needs to be decorrelated enough compared to the signal that stacking can additively average out the noise, leaving proportionally more of the signal to see. Interpreting stacked data is challenging, though - as you will see if you make it through this long post!
The basic idea of the study is to ask whether GPS sites near upcoming earthquakes tended to move in the same direction as they did during the actual earthquake, but during the period before the earthquake began. The authors contend that they can see this happening in stacked time series data from many earthquakes around the world. Because this is a major claim, we read the paper carefully and started digging around to see how the method works. In this post, we get into some gritty details and explain why we think the method, and the conclusions, are fundamentally flawed. Of course, that’s quite a claim to make, especially so quickly after publication. But we will keep our caveats until the end of the post.
The method
Bletery and Nocquet (2023) examine high-rate GPS time series data in the vicinity (closer than 500 km) of large (M7.0+), shallow (<60 km) earthquakes that occurred in areas with high-rate GPS stations. They identified 90 earthquakes prior to 2020 that fit these criteria. They then used a focal mechanism for each earthquake to estimate the horizontal displacement that each nearby GPS site would expect to experience if an earthquake occurred on a very small fault patch at the hypocenter location (where the earthquake initiated). This is necessary because there isn’t just one direction of motion during an earthquake: some parts of the crust move towards the rupture, others are pushed away. The authors calculate how well the observed displacement at each site in the two days before the earthquake matched this expected direction using a mathematical function called a vector dot product.
The vector dot product is simple: if the site motion is in the same direction as the expected motion, the dot product is equal to the product of the site motion and the expected motion. If the site motion is perpendicular to the expected motion, then the value of the dot product is zero. If the site motion is opposite of the expected motion, the dot product is negative. Sites that are far away from the hypocenter location have a very small dot product value, because the expected motion is small. Sites that are close to the hypocenter location can have large values, either positive or negative, because the expected motion is larger. So by taking this dot product between the data and the model, the authors are trying to isolate the component motion that is consistent with the upcoming earthquake.
Unfortunately, no single time series shows a clear precursory signal. Thus, the authors try to overwhelm the problem with a massive amount of data. After calculating the dot product for all GPS time series samples, and for all earthquakes, the authors calculate a ‘stack’ of data by adding the dot product time series together. This stacking can be done on a per-earthquake basis, using only GPS sites near the earthquake, or can be done at a global scale: all earthquakes, all sites, at once.
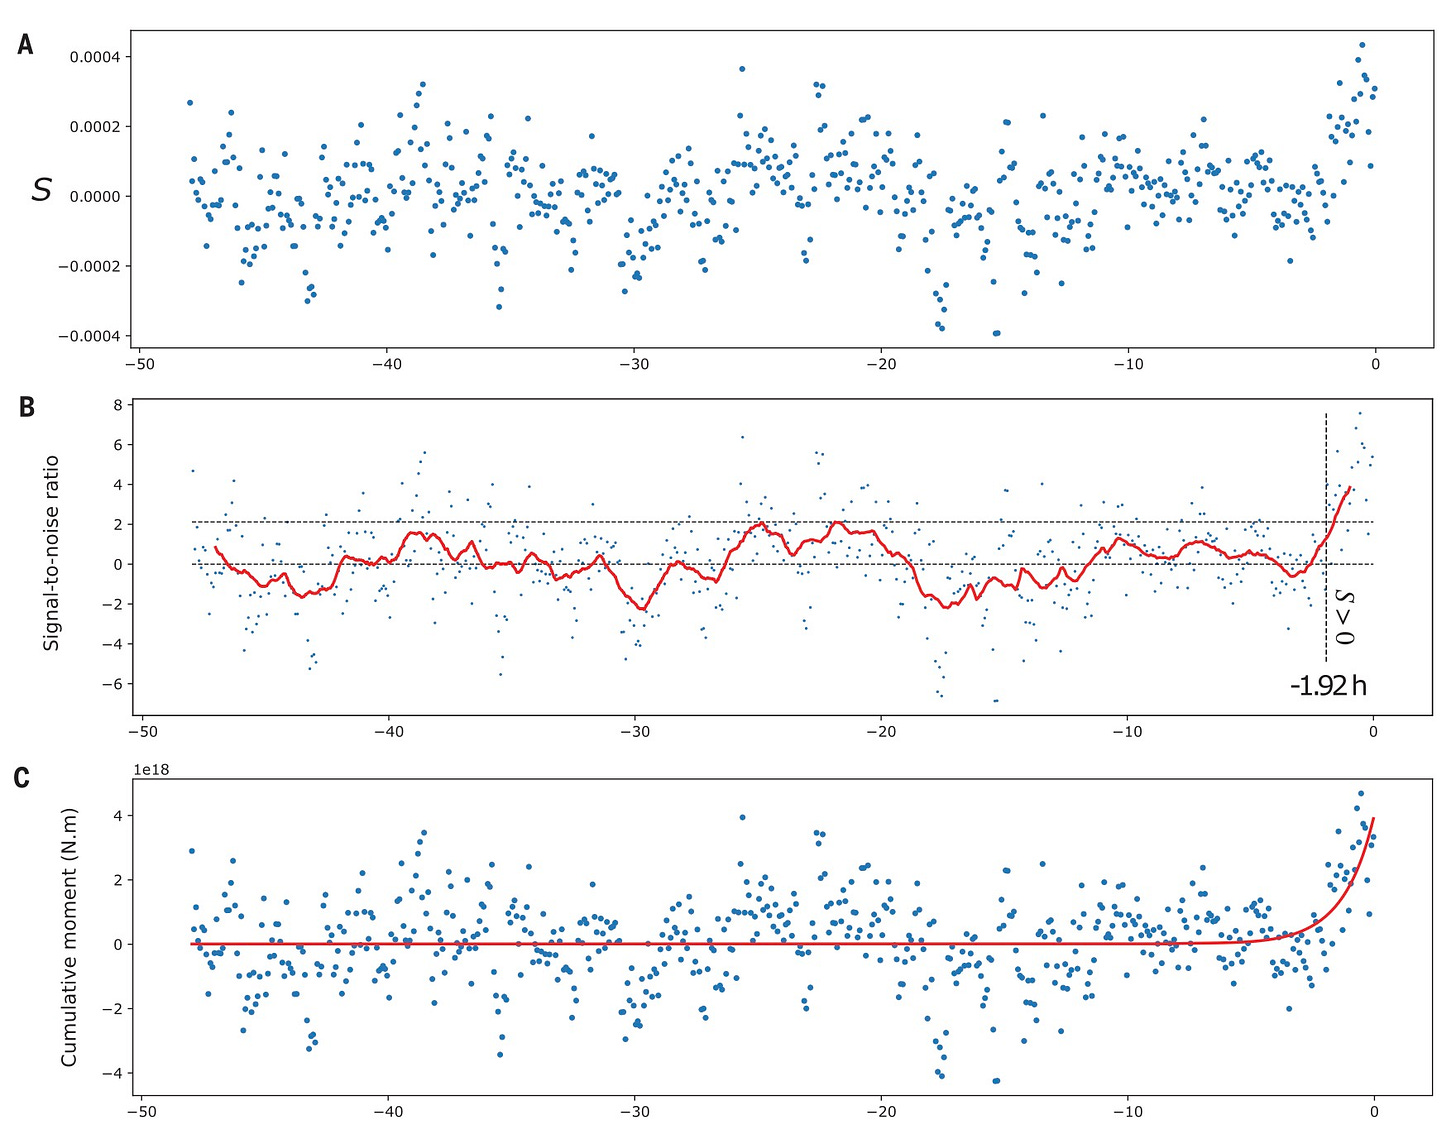
The biggest claim in the paper is that we can see motion in the eventual earthquake slip direction during a two-hour period before the mainshock. The figure below shows the globally stacked time series, with a steep rise at the end (uncomfortably similar to the classic ‘hockey stick’ diagram that introduced us all to global warming!).
The stakes are pretty high here. Even if we were only able to detect this motion 5 minutes before the upcoming mainshock, we could make huge progress in saving society from the effects of large earthquakes - by using those minutes to evacuate buildings and coastlines, and shutting down infrastructure like power plants and trains. Any more extra time would be icing on the cake. Furthermore, just because we can see a precursor with high-rate GPS doesn’t mean that it is the best way to monitor for them. Once we know that precursory slip is common enough to stand out in a global stack of data, we can start to think about more clever ways to see it happen in real time.
BUT
What is the effect of GPS noise on the analysis?
The data used in this study come from the University of Nevada at Reno, which operates a classy geodesy laboratory that processes data from a huge number of global GPS sites into a consistent, curated, and freely downloadable database. The scientists at UNR spend a lot of effort ‘fixing’ the problems with GPS time series data. For instance, whenever an antenna is changed because someone blasted the dome off with a shotgun, or whenever a large earthquake occurs that moves all the stations around by huge amounts, the UNR people make corrections that restore the sanity of the data.
But even after correcting for these major factors, high-rate GPS position data are a lot more ‘squiggly’ than you might expect. When nothing is happening on land (no earthquake, no landslide), why should GPS sites move around? But they do! Let’s look at the East component of an arbitrarily selected site located in southern Japan, over the two day period before the 2011 Mw 9.0 Tohoku-Oki earthquake. Note that this site is located almost 380 kilometers away from the epicenter of the upcoming M9.0 earthquake.
Despite being so far from any recent or impending earthquake source, the site is moving around by between 2-4 centimeters horizontally and vertically, with a fairly random oscillation (we realize that foreshocks had already occurred in the area of the eventual mainshock, but we want to use data from the published time series).
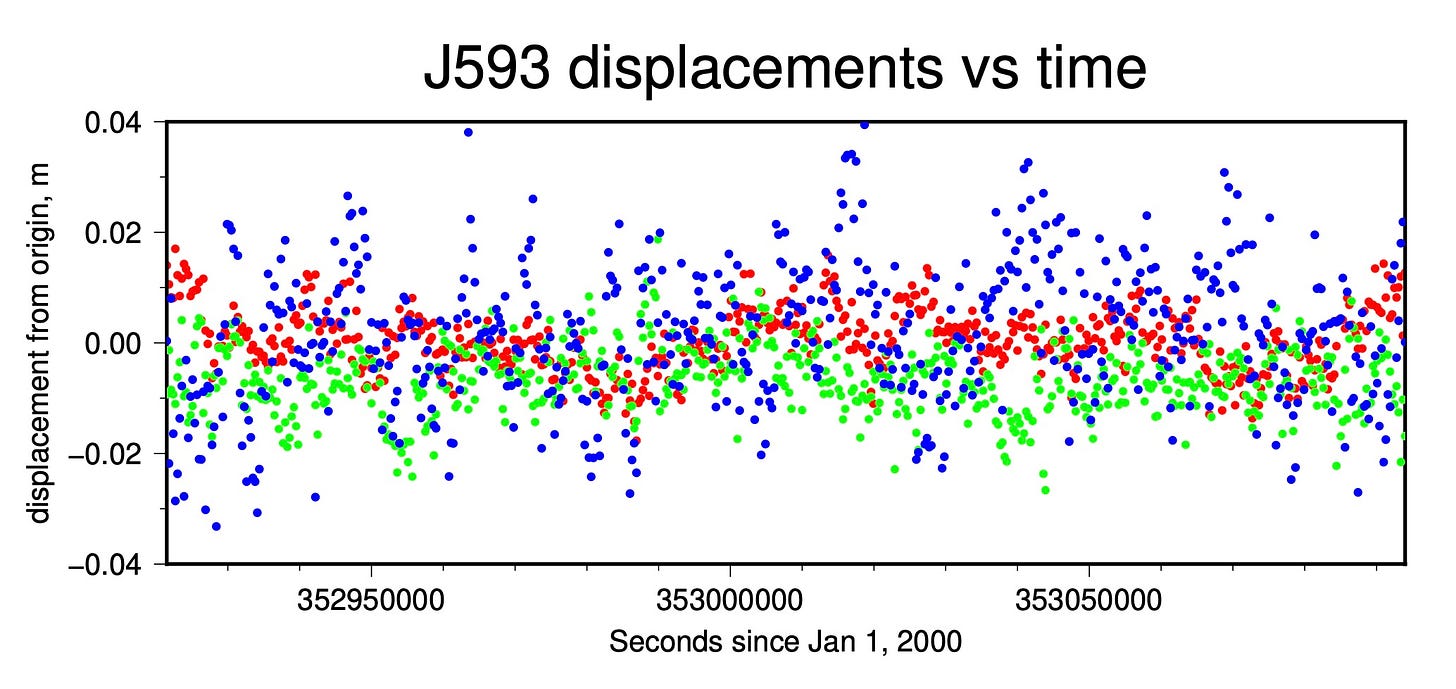
This type of noise remains in most, if not all, of the time series data used by Bletery and Nocquet (2023). It is very hard to determine the physical sources of the noise and make realistic corrections. Even careful corrections have a probability of removing signal that some other researcher might want to study - thus, the wiggles remain. Ideally, this noise would be random at each site, or at least be coherent only over a few sites, so that stacking the offsets from many sites would additively cancel out the noise, increasing the signal-to-noise ratio in the stacked time series. And, since earthquakes occurring around the world and over a period of decades shouldn’t have strongly correlated signals (seasonal trends, etc), it seems reasonable to think that blindly stacking the high-rate data would increase the signal-to-noise ratio, allowing us to see processes like precursory slip.
However, most of the main causes of high-frequency GPS noise are likely to affect large areas simultaneously, even at the scale of regional GPS networks. Even things like the changing weight of the atmosphere due to humidity (e.g. weather) can cause systematic oscillations due to actual ground motions; winds, ocean tides and currents are other important examples. There are also a number of technical effects inherent to the GPS location process (like the changing velocity of radio waves beamed from the GPS satellites through the water-vapor laden atmosphere) that can affect the entire network - but please contact your local GPS specialist for a lecture on those. These kinds of noise are called common mode noise because they are common to all or most sites in a local network. Stacking common mode noise over a GPS network will not increase the signal-to-noise ratio, because the noise is highly correlated between the sites. Luckily, many GPS-based studies can afford to ignore high-frequency noise (the wiggles that occur over minutes to hours) because they only care about longer period effects: daily, weekly, or even monthly data averages can be used. This averaging does suppress the wiggly-ness of the high-rate data.
Bleterly and Nocquet (2023) did not account for common mode noise in their analysis of the time series data. (We note that there is a short section at the end of the supplementary information where the per-sample median North and East components for the entire Tohoko-Oki network are removed to examine a very specific technical question about the data following common mode noise removal - but this correction was not done for the main study.) Thus, the time series examined seem to have a lot of inherent hourly wiggliness.
We wondered what would happens to the earthquake precursor analysis if we tried to remove regional common mode noise from the GPS time series before stacking the global data. If we could reduce the non-earthquake-related wiggles by removing as much widely correlated noise as possible, for each network that sensed one of the target earthquakes, maybe we could see the two-hour signal better - or (spoiler alert) not find it at all.
Our strategy was to try to remove common mode noise from the times series data, while preserving as much of the signal in the vicinity of the earthquake hypocenters as possible. This goal was intended to respect the theory that there is meaningful signal in GPS sites near earthquake nucleation zones.
When removing common mode noise, it is easy to remove actual signals from the data - which would of course be bad. To avoid this, for each earthquake, we calculated the mean per-sample displacement of the East, North, and Up components of all sites FARTHER from the hypocenter than 200 km, and then subtracted the resulting time series from each site time series in the full dataset. If there were fewer than three sites outside of this selection radius, we did not calculate an average and simply used the raw data in the stacking process. Notably, if an earthquake was only observed by one site (N=22 events), we excluded it from our analysis. This is because we really have no hope of assessing noise - common mode or otherwise - in a single time series; the total contribution of these earthquakes to the global stack is very small in any case. We left in a number of earthquakes with more than one, but still very few, far-flung sites - we aren’t really sure whether we should enforce a minimum site count, but didn’t want to alter the workflow too much. So we still included a lot of earthquakes that were only observed by (for example) two GPS sites located >300 km away. Fortunately, given the way the dot product works, these sites contribute virtually nothing to the regional or global stacks anyway.
We updated the original data files in-place so that we could preserve the workflow of the Python notebook provided by the authors. After removing the common noise from the relevant sites, we simply ran through the code that produced the paper’s original figures. By comparing our new figures with the published ones, we hope to convince our readers (a rarified group indeed!) that noise is important here.
A side note: Sharing is caring! Providing open-access data and code makes science better
Before we proceed with our work, we want to thank the paper's authors for the very nice code and data that were provided in the supplementary information. The high quality and clear organization of their supplemental data has allowed us do a detailed re-examination of their study by following their analytical workflow exactly. We were able to replicate the figures in their paper within about an hour of starting work, with most of that time dedicated to the usual boring Python environment configuration. From there, we could write our own snippets of code to modify the input data and make some charts and maps, and we then simply ran their workflow again to produce new figures directly comparable to the publication. This is an exciting way of doing critical science and we are indebted to the authors for their efforts in this direction.
Our Results
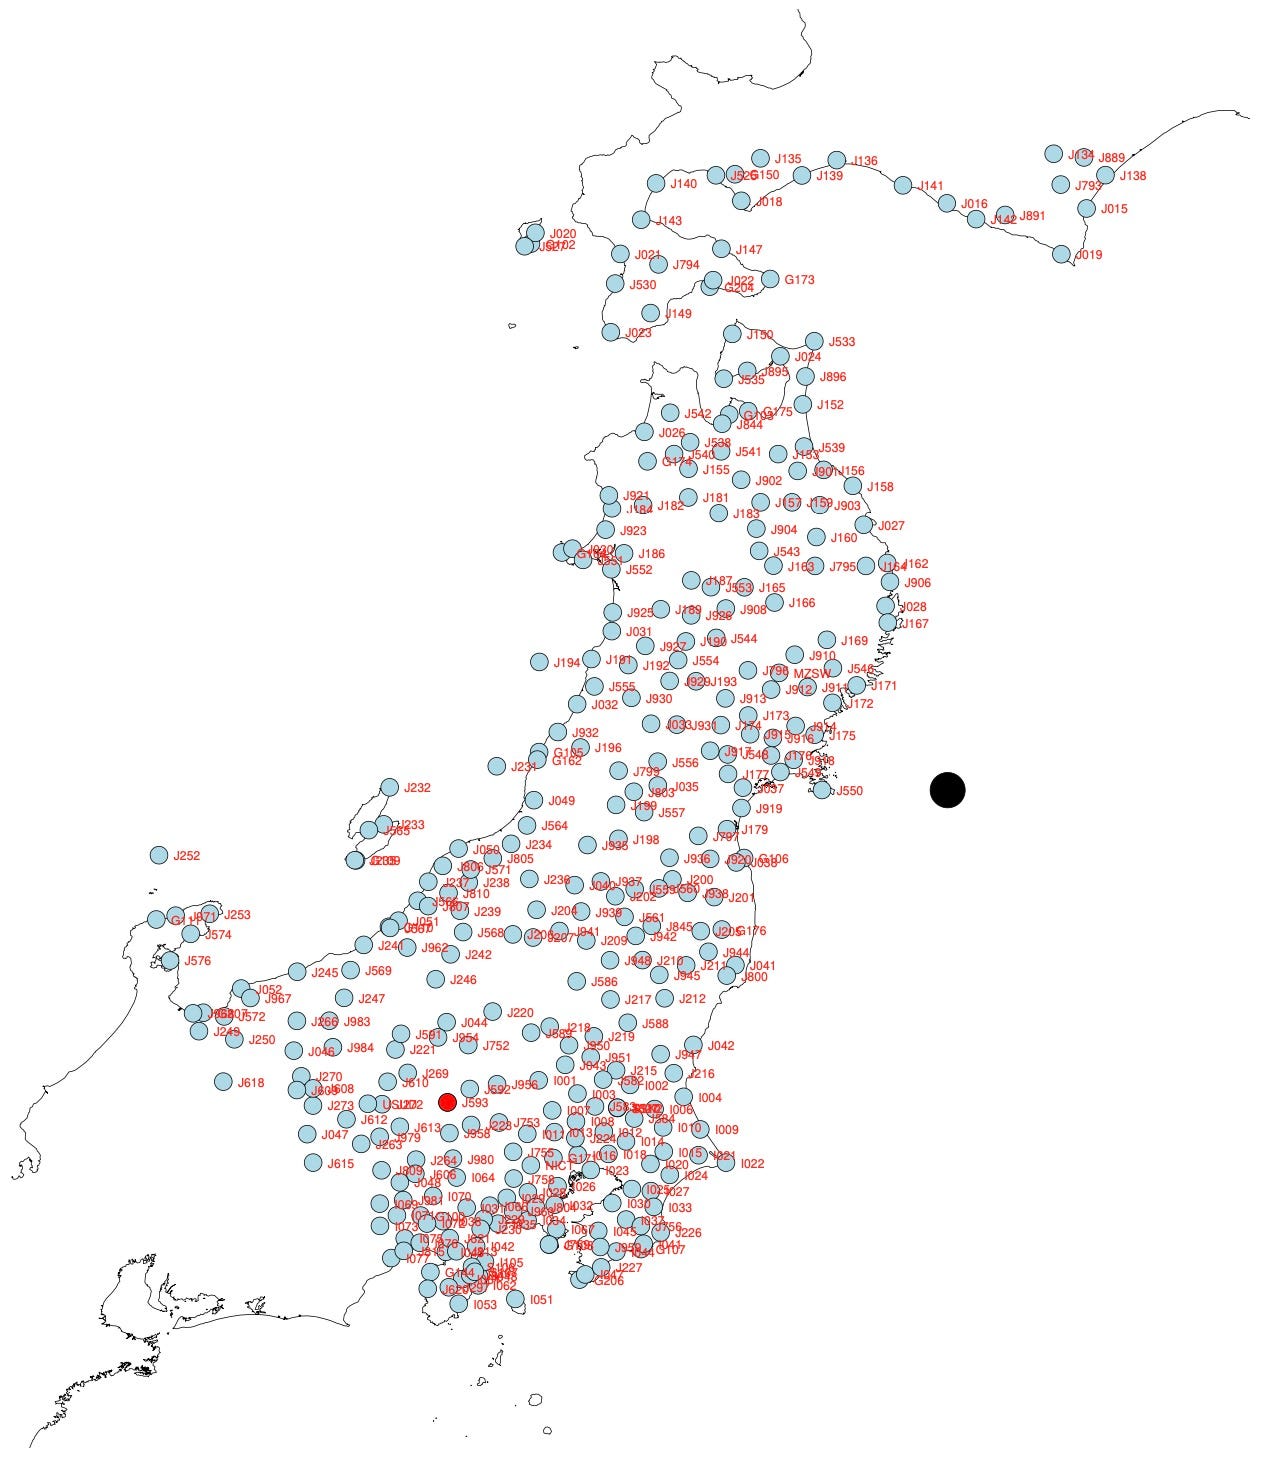
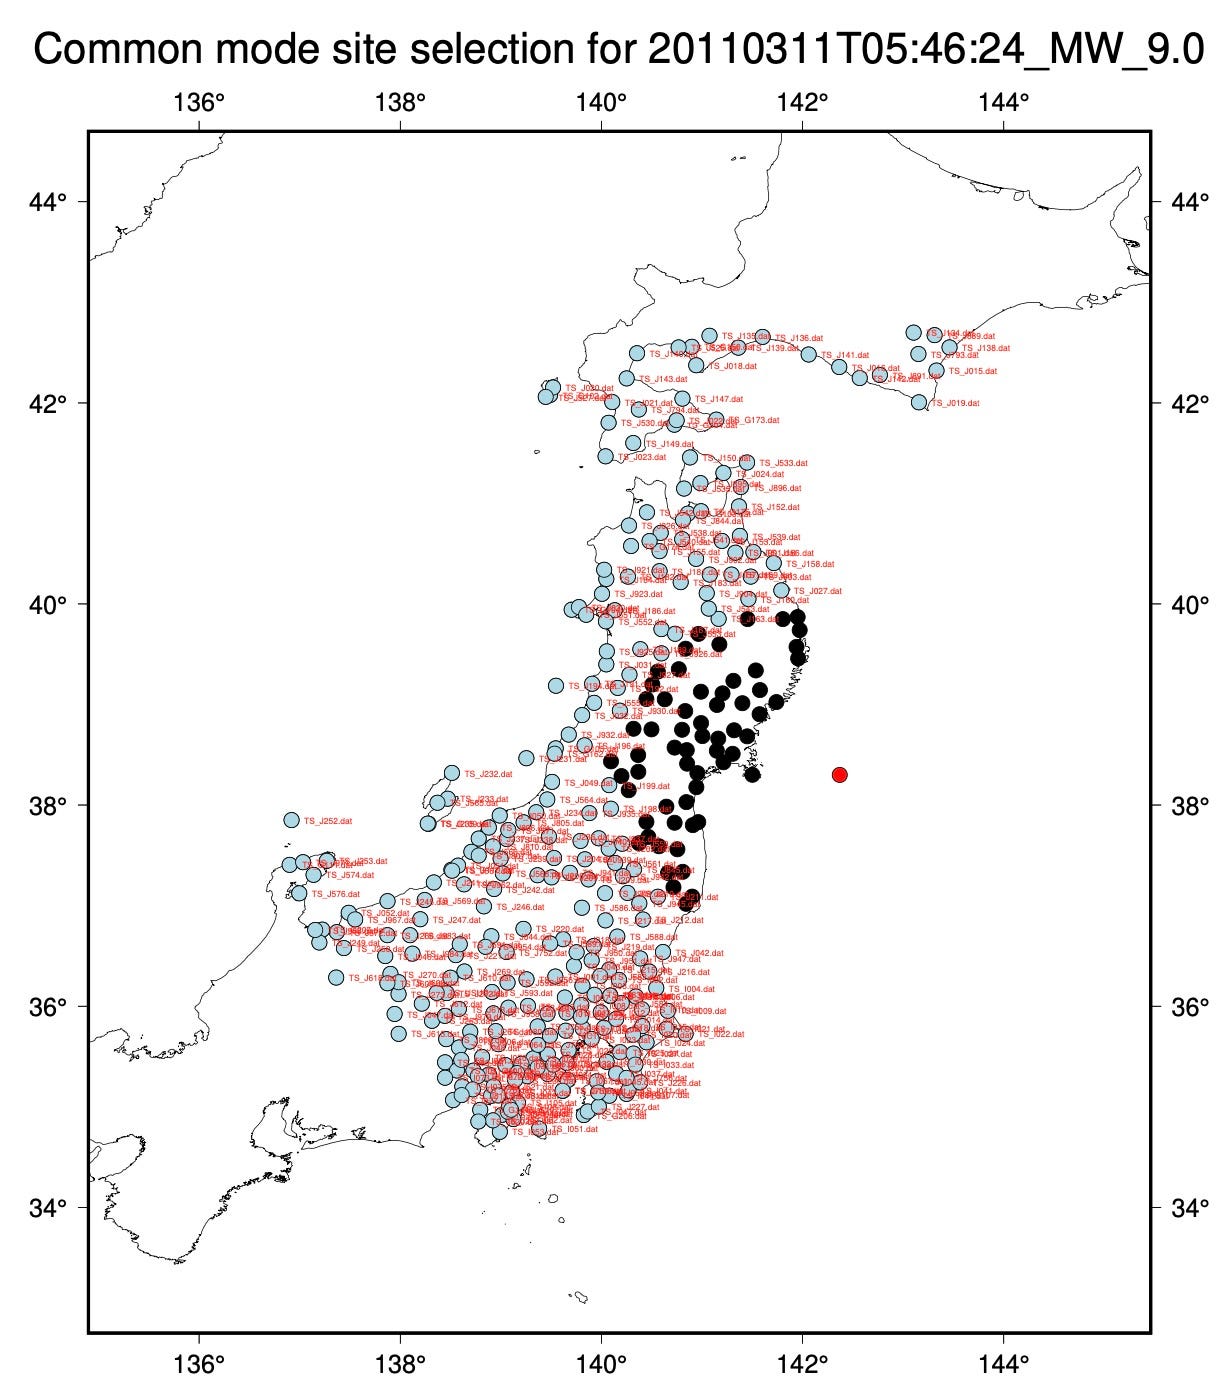
Let’s start with an examination of the most important earthquake in the dataset: the March 11, 2011 Mw9.0 Tohoku-Oki earthquake. The map below shows our site selection. Blue sites are farther than 200 km from the hypocenter location (red dot offshore), and are included in the common mode noise calculation. Black sites are excluded from the common mode noise calculation. All sites are corrected for noise by direct subtraction.
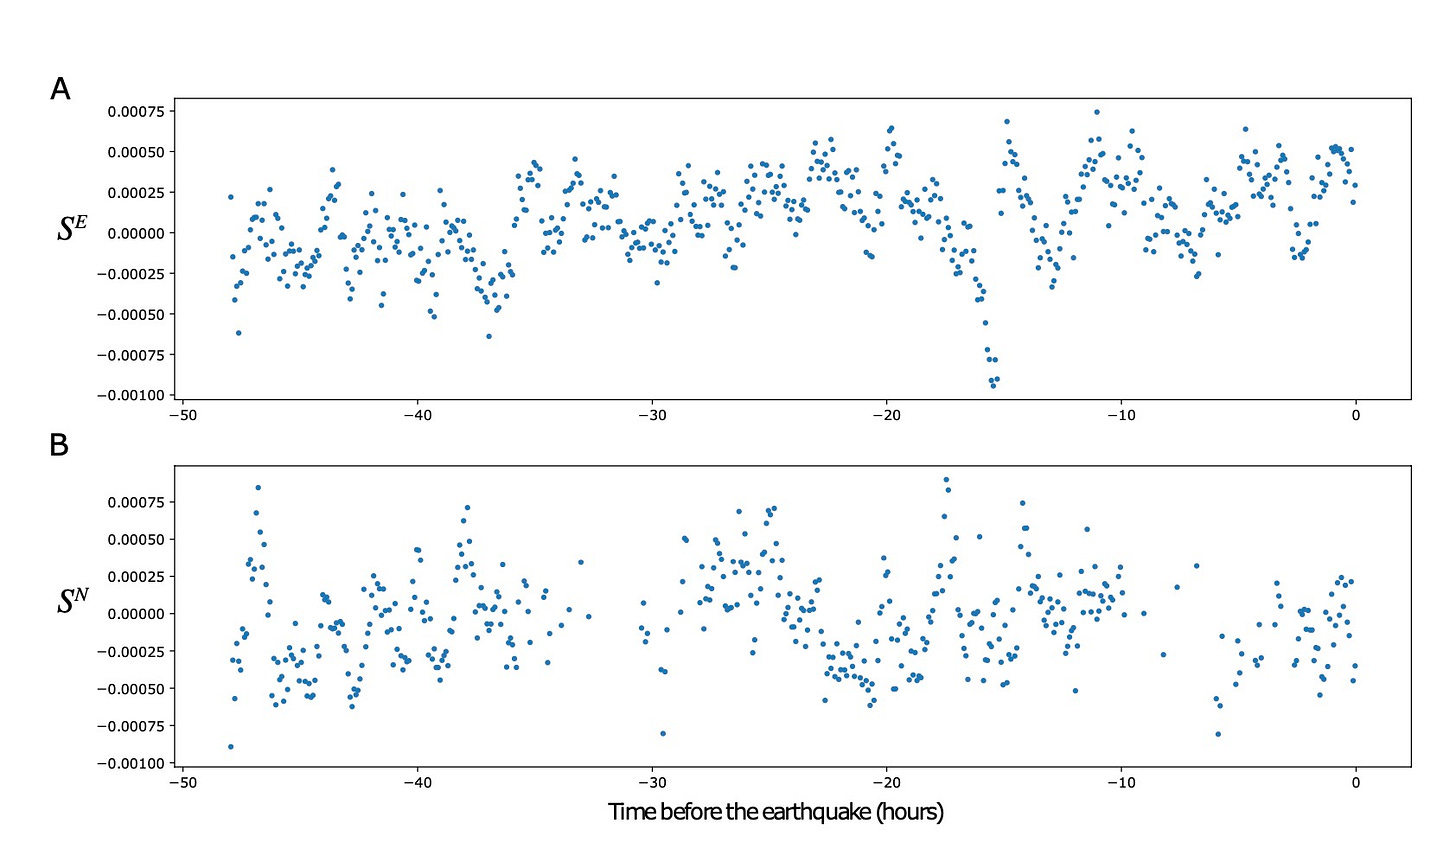
The 48 hour pre-earthquake common mode noise time series, calculated from 294 of 355 sites, is shown below. It is immediately apparent that there is a strong, oscillatory average signal within the network at sites far from the earthquake origin location.

What about the sites located WITHIN the 200 km radius? If the signal were to look somewhat similar, then we could conclude that those sites also carry similar common mode noise. So, we did the same calculation for those 61 sites. We found that those sites also have a clear oscillatory behavior, of a similar magnitude as the far-field sites. You can also see close similarities between some of the wiggles of the two common mode noise time series. This suggests that we can try to correct the network by removing (subtracting) the far-field average from all time series. There are possibly (probably) better ways of doing this, but this seemed simple enough to us.
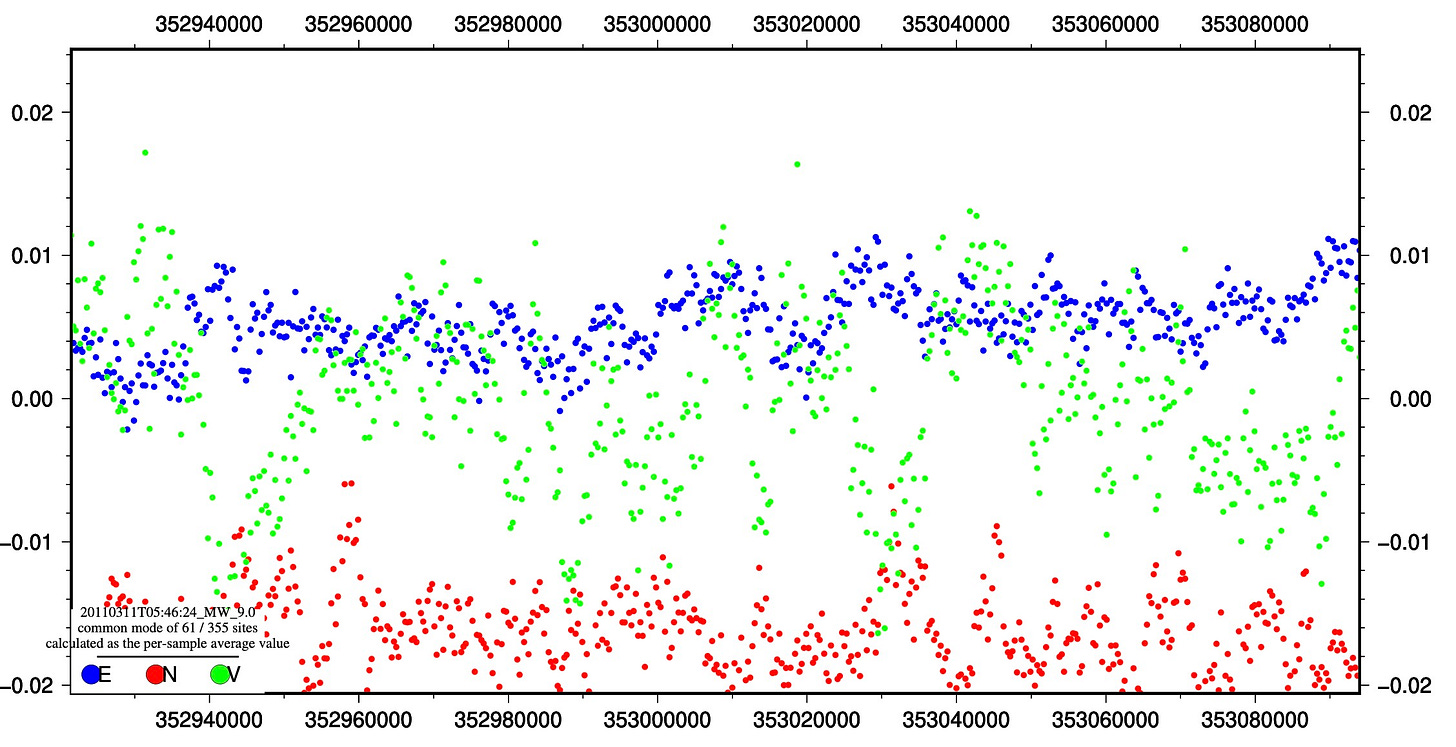
We did this for each earthquake in the catalog, and then subtracted the far-field common mode signal from the time series (for events that have sufficient sites - if we didn’t calculate a far-field common mode signal, we just kept the raw data). Then, we re-calculated the global data stack.
Recall the hockey-stick figure from the original publication (the global stack without noise removal):
After removing far-field common mode noise, the hockey stick at the end (time = -2 hours to time = 0 hours) disappears. In fact, the global stack time series is now decreasing when the earthquakes strike (time = 0 hours). The peak-to-peak amplitude of the stack also decreases a little bit. It’s not yet clear whether removing all of the sites with no common mode correction would decrease that further.
So, the global data isn’t as exciting after applying the noise correction. There appear to be just as many ups and downs in the days preceding the earthquake as in the last hours. But what does the stacked signal look like for the individual earthquakes?
Correcting the 2011 Tohoku-Oki earthquake
We calculated the corrected time series for Tohoku, and discovered that we apparently removed a lot of signal: the amplitude of the remaining stack is about 90% smaller. Thus, the far-field common mode noise must have contributed a lot to the near-field data. It is likely that common mode noise has different magnitude effects for different networks, and possibly during different time intervals as well.
Here is the plot provided by the authors for the Tohoku earthquake - without noise correction, and for only the 24 hour period before the mainshock:
After noise correction, it is easy to see that a high-amplitude periodic signal has been removed by subtraction of the far-field common mode signal:
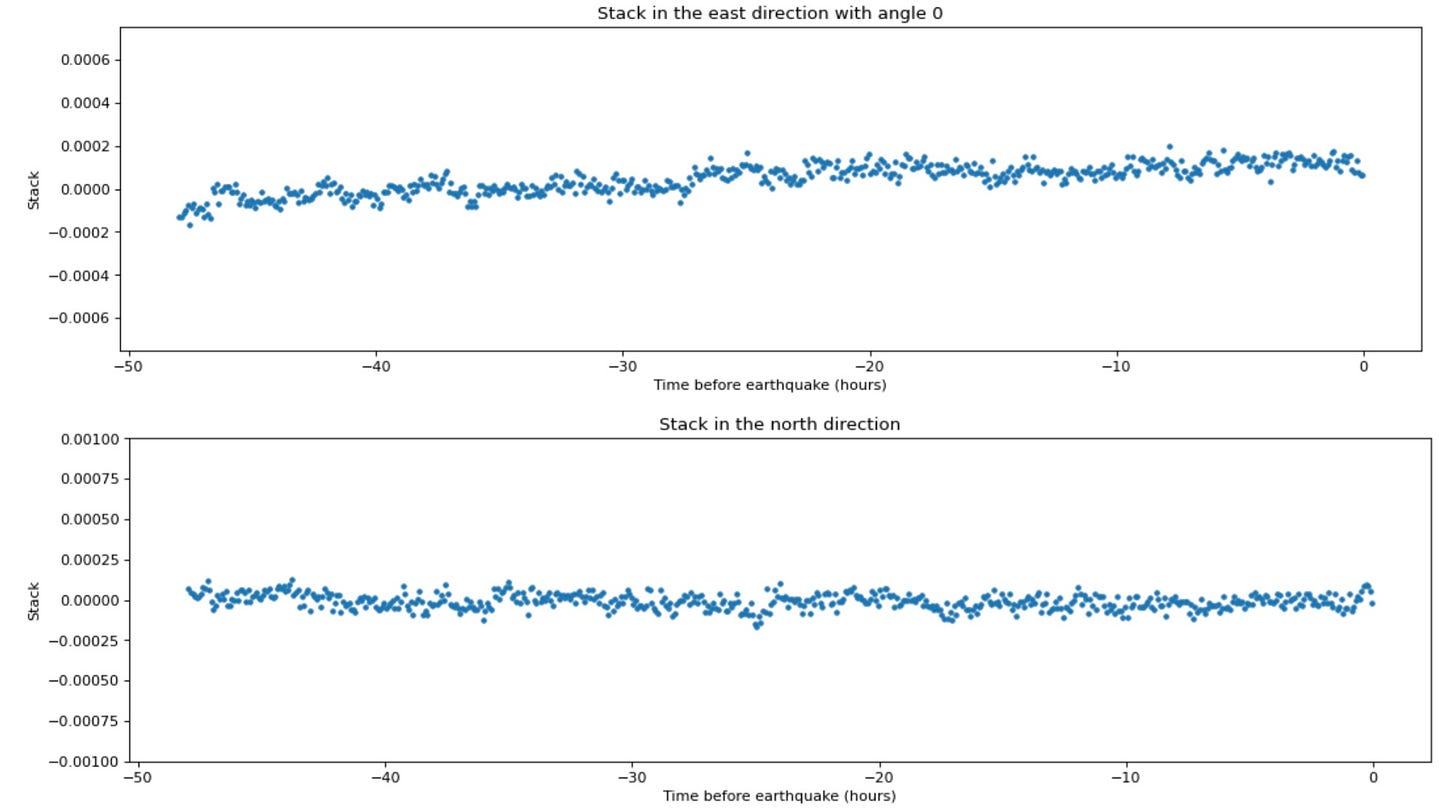
When we plot the 48-hour Tohoku data stacked in the N,E directions separately, the resulting plots are similar.
Before (published figure):
After (noise corrected). The North direction stack is centered around 0, but the east direction stack drifts positive at a somewhat constant rate:
If we plot the new (noise-removed) stack at a different y-axis scale, we can see more details of the stacked signal. Note that these are very small positional changes compared to the non-corrected time series:
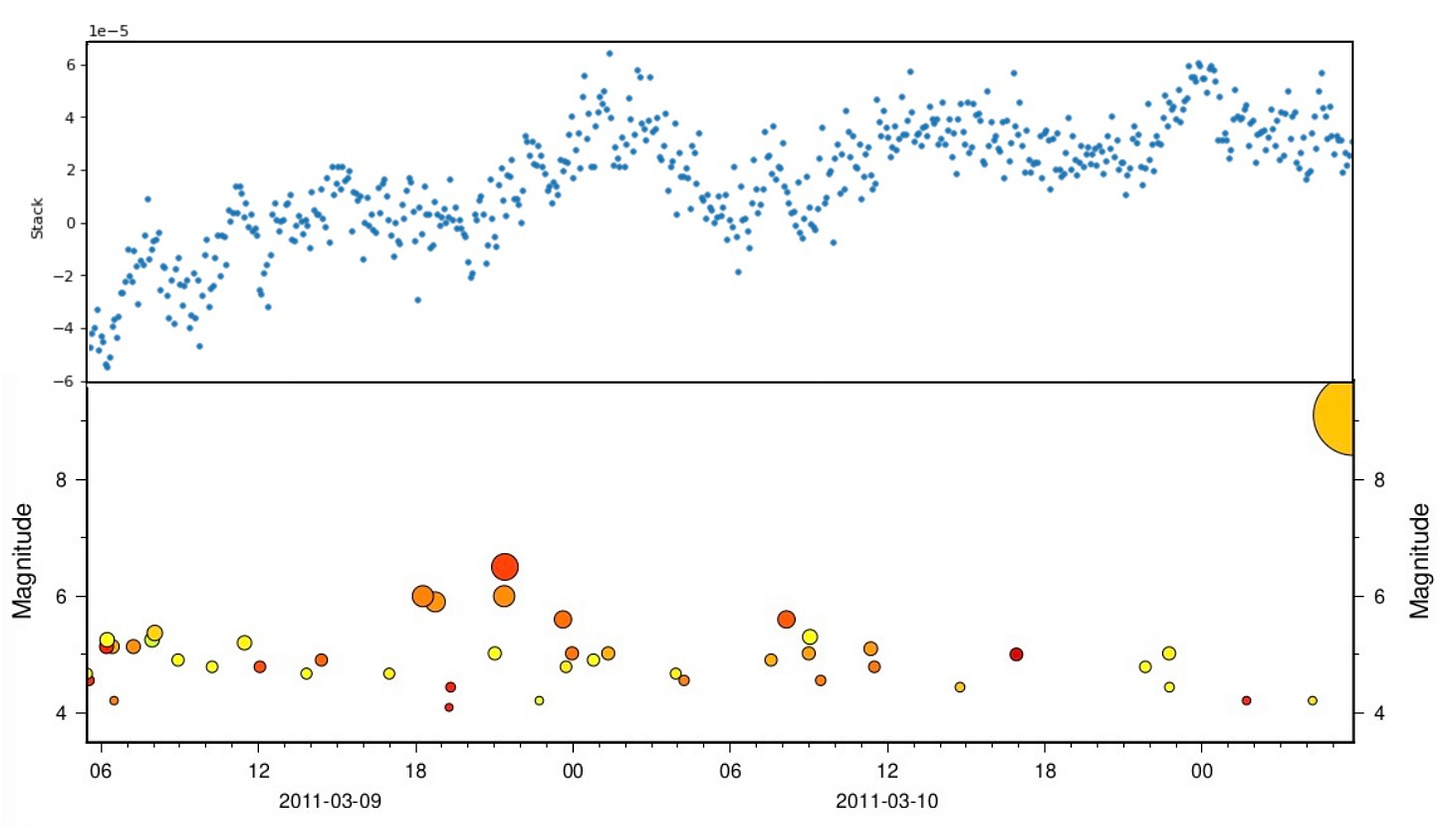
We observe a general positive drift (maybe looking like steps?) in the direction of the impending earthquake slip, but no clear sinusoidal signal. Upswings are clearly occurring in the days before the mainshock, but there is no upswing right before the mainshock.
A plot of the seismicity timeline for the same 48 hour period (below) shows that upswings in the noise-corrected, stacked data could feasibly be correlated with the occurrence of larger events in the foreshock sequence (aftershocks of the M7.3 foreshock…). So it seems plausible that we are actually seeing geological signals in the noise-corrected stack - but at much smaller amplitudes than the signals discussed in the paper. Note that the upswing at the start of the time series (48 hours before the mainshock) postdates the M7.3 foreshock event that falls just left of the time series, roughly 51 hours before the mainshock - so the initial eastward trend also makes geological sense as a postseismic, or ongoing seismic, response to the M7.3 earthquake.
Let’s look at a second important earthquake
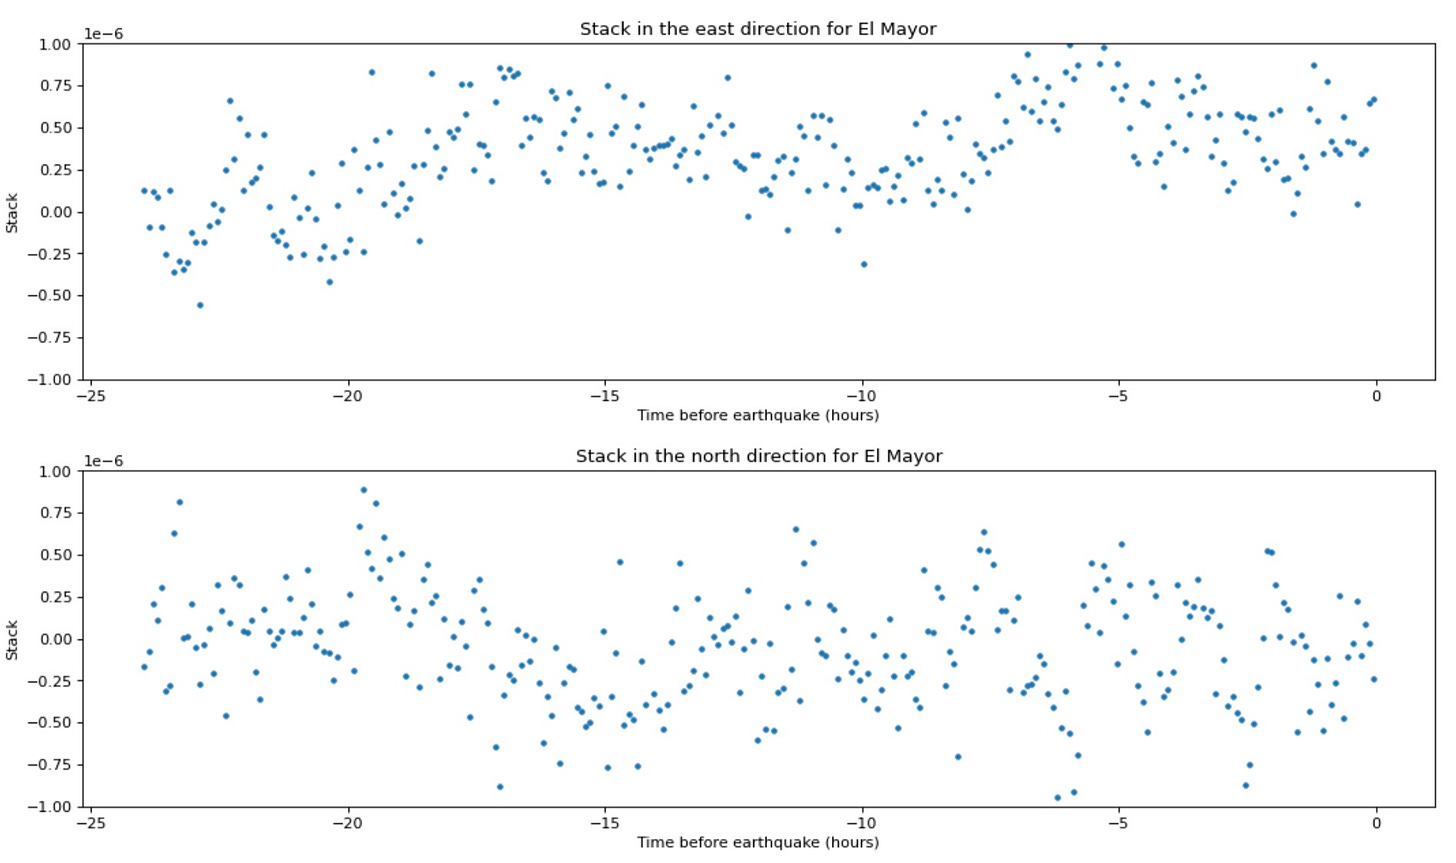
The April 4, 2010 El Mayor-Cucapah earthquake also contributed significantly to the detected precursor signal in the global stack. Like Tohoku, this earthquake has a well-documented and complex, month-long presursor sequence including many foreshocks. What can we learn from removing common mode noise?
180 of 236 stations are more than 200 kilometers from the earthquake location:
The estimated common mode noise signal (recall that this is just the average value of the qualifying time series data) from the far-field sites:
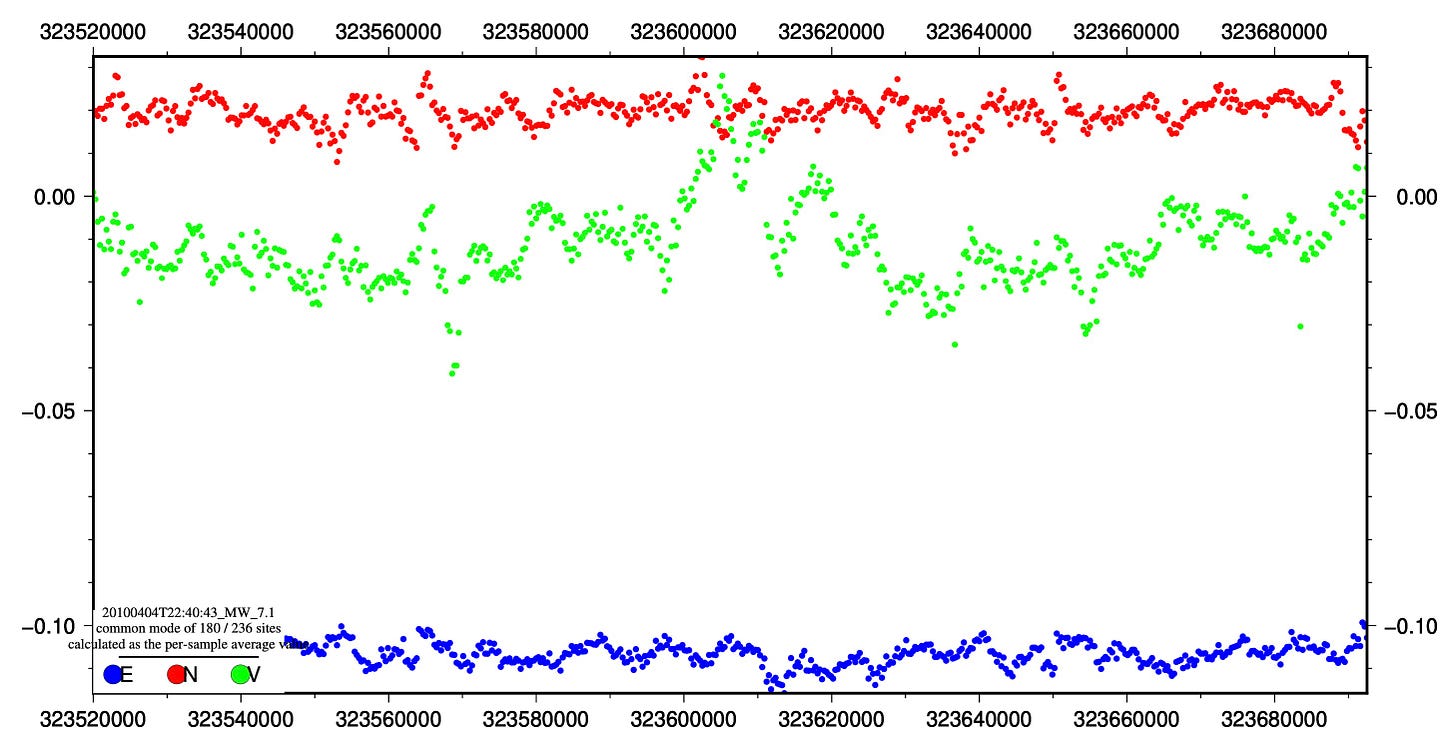
The average of the near-field sites is quite similar in appearance, clearly including some of the most prominent wiggles.
The North and East stacks for the El Mayor-Cucapah earthquake, without noise correction (data are the same as from the published paper; the figure is new):
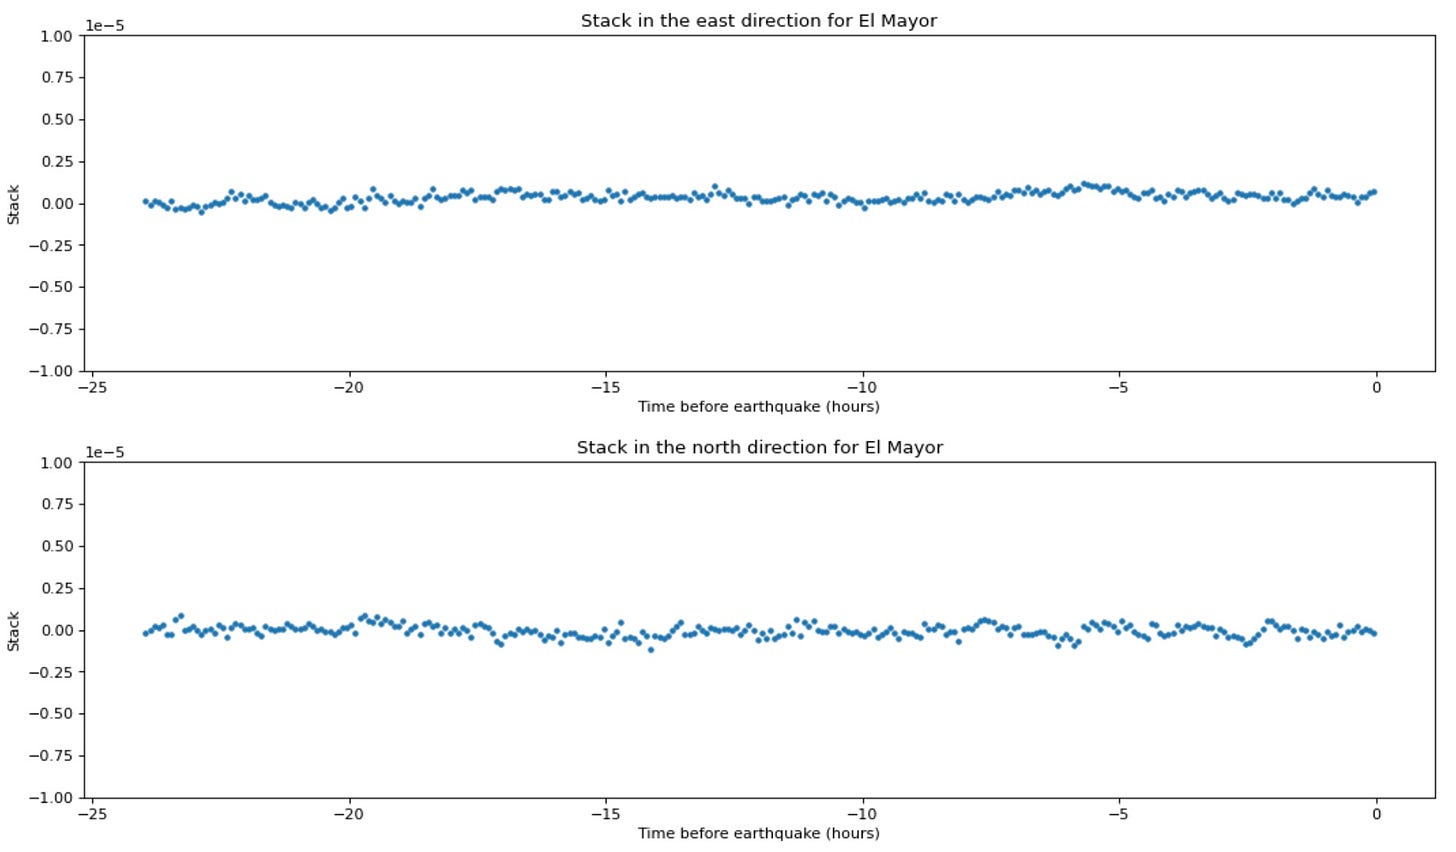
The North and East stacks after correction and at the same y-axis scale; the large oscillatory signals are mostly gone and we have fairly flat time series:
By rescaling the y-axis, we can see the remaining signal in the noise-corrected data better. There is some interesting periodic behavior remaining for this earthquake, which may reflect uncorrected noise or possibly some kind of precursory behavior, given the known foreshocks.
Summarizing the most “precursory” earthquake stacks
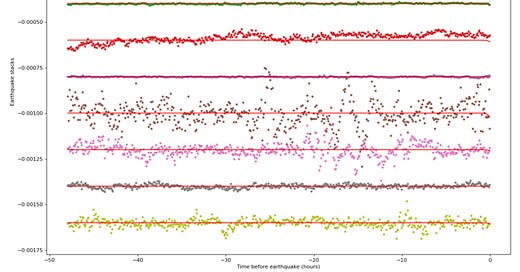
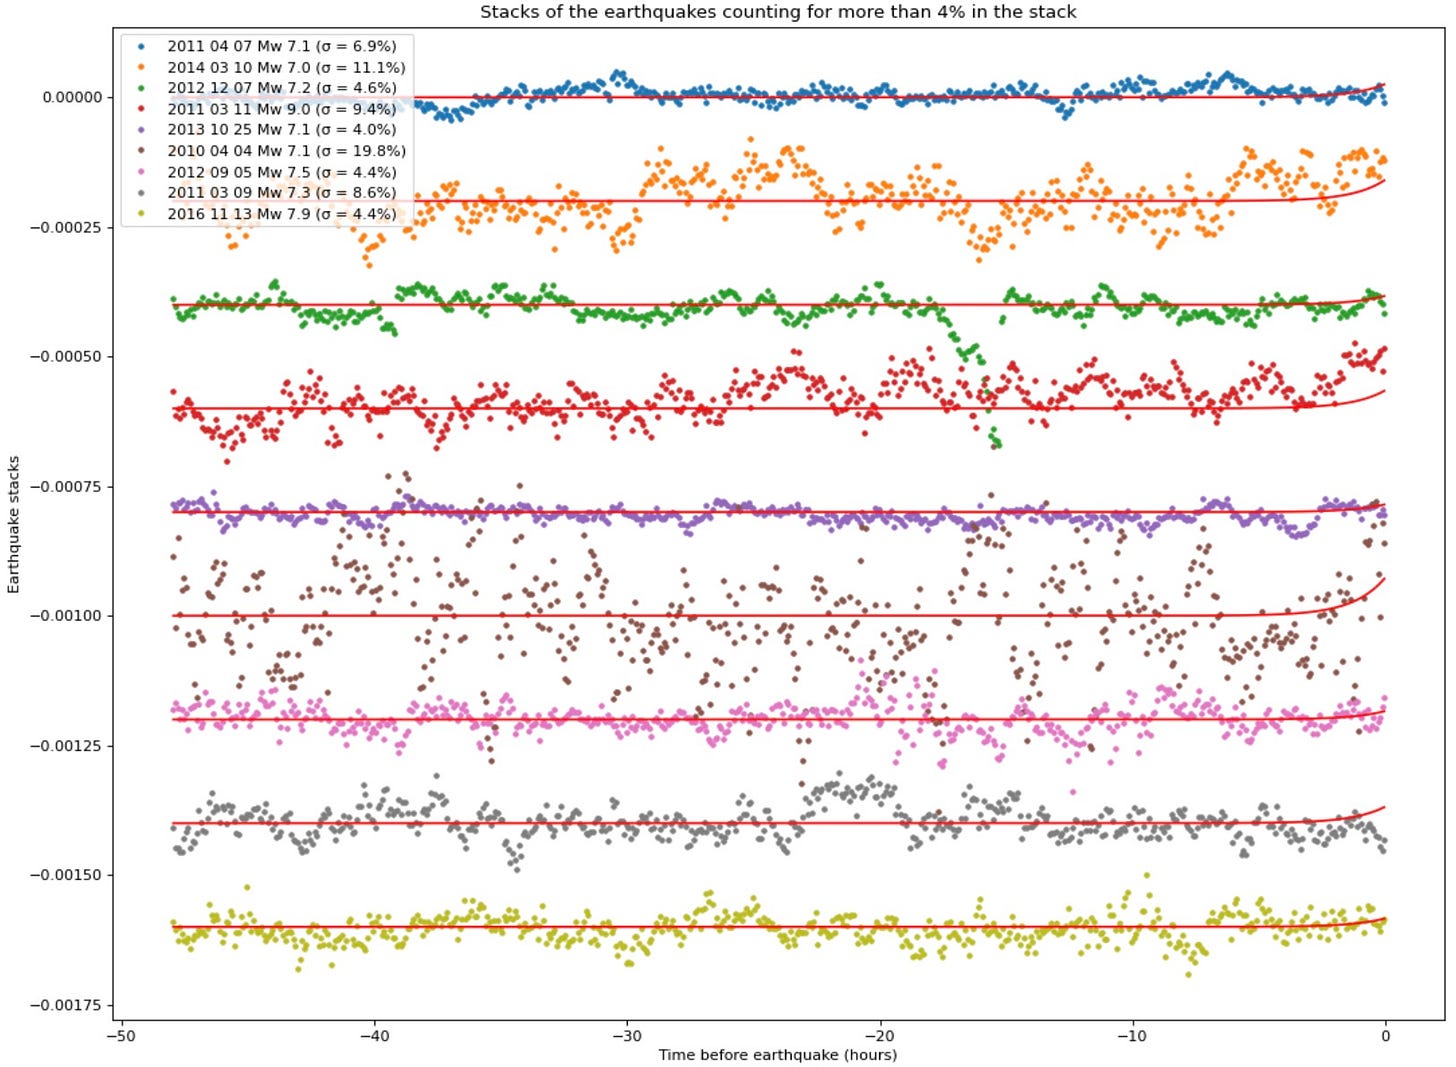
Looking at the trends of the non-noise-corrected vs noise-corrected time series for earthquakes that contribute the most toward the positive stack, you can see how the wiggliness of the original data series is largely due to uncorrected common mode noise.
Regenerated from the original paper (non-corrected):
The time series for the same events, corrected for far-field common mode noise:
So, correction of correlated noise using far-field sites clearly reduces or eliminates the wiggles for many, but not all, earthquakes. The fact that the original wiggles are so prevalent, and so tall, compared to the residual (corrected) data suggests that non-corrected stacked data probably cannot reveal any subtle fault behaviors. It is interesting that the El Mayor-Cucapah earthquake (the brown dots, 6th row from top) shows a lot of action in the 24 hours before the mainshock. This coincides with a major episode of precursory seismic activity.
(Knowing how geophysics works, there is probably a much better way of doing this correction…!)
Periodic signals in pre-earthquake time series
While we have mainly discussed the “last two hours” conclusion of the paper, a significant effort in the manuscript is also devoted to interpreting the periodic signals within the data series. These periodic wiggles are evocative of some well-known periodic processes in earthquake physics, like harmonic tremor or pulsed slow-slip events, each of which can be relevant to precursory fault slip. So it is exciting to see a periodic signal in the days before an earthquake.
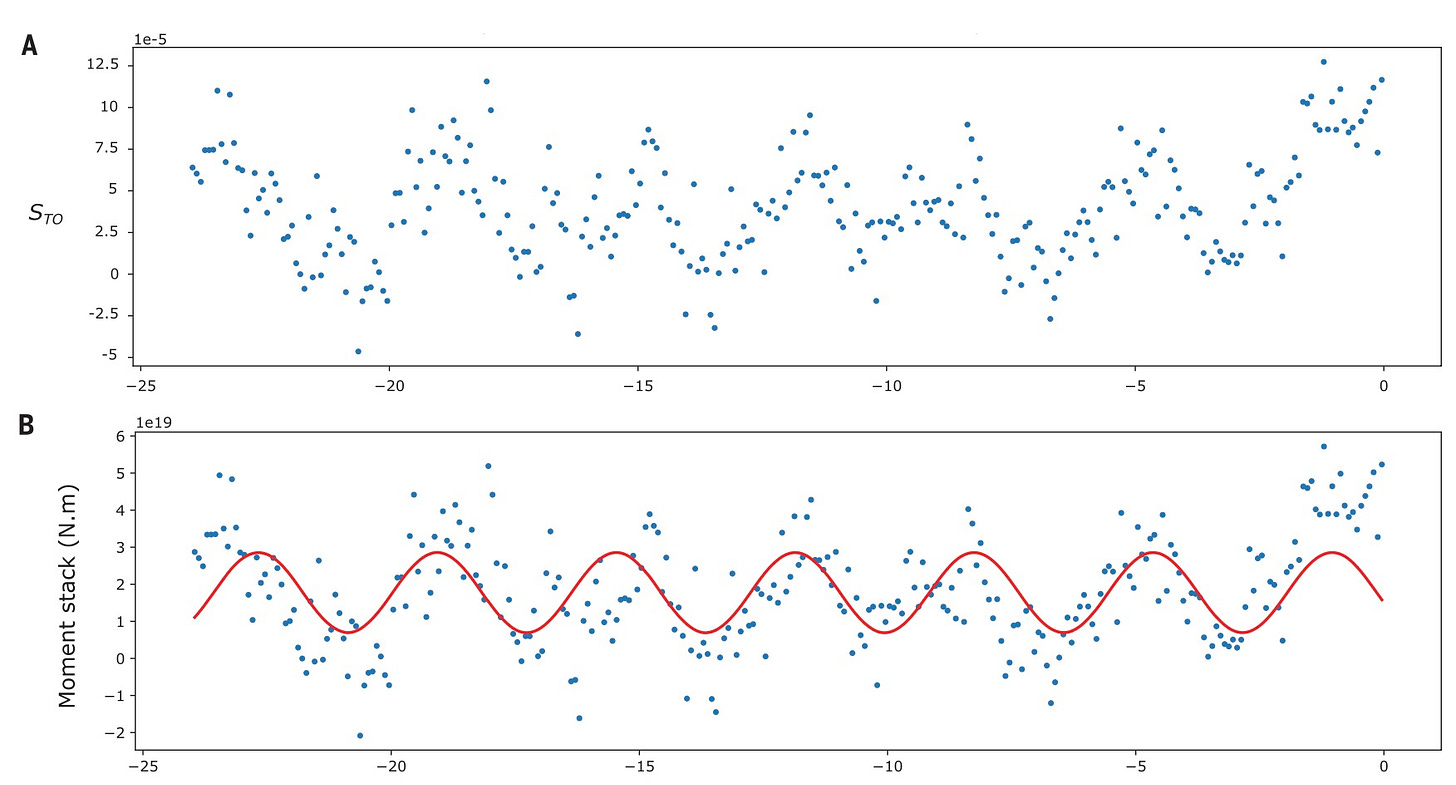
Sinusoidal wiggles from the day before the Tohoku-Oki earthquake:
These sinusoidal wiggles are attributed by the authors to real fault behavior - periodic aseismic slip - in the precursor phase. They do not discuss or investigate how early this behavior appears in the time series. We believe that these wiggles are inherent to the uncorrected time series at almost all times, for almost all earthquakes, and likely extend to the left of the chart as well. Since the wiggles seem to disappear after noise correction, we suggest that they are not physically related to earthquake nucleation. Many of the arguments in the paper (and the supplement) about these cycles, including inferring the location of precursor slip, therefore seem particularly hard to support.
What does this all mean?
As far as we can tell, uncorrected noise in high-rate GPS time series data fundamentally compromises the paper’s claim of discovery of two separate phenomena: two hours of enhanced slip prior to large earthquake nucleation, and sinusoidal oscillation of the fault patch in the day(s) prior to the earthquake. Thus the two main conclusions of the paper appear to arise from misinterpretation of non-earthquake physical processes inherent to high-rate GPS time series.
Is there a 2-hour precursory signal before major earthquakes? Maybe, but we can’t convince ourselves that the conclusion is sound. In our opinion, this study needs to be revisited with greater care, paying particular attention to coherent noise in the data. Perhaps better corrections of the GPS data are possible than our initial attempt - there are models for atmospheric loading, etc. that can be used to make physically informed corrections rather than relying on a non-physical correction like ours.
Earthquake prediction?
Other commenters have already noted that even if the proposed method were sound, we would still not be able to use it to predict impending earthquakes. This is because the ex-post-facto approach (if it worked) only shows what already happened, but cannot be applied to incoming high-rate GPS data. The common mode noise itself is so prominent that any trigger criteria for a network looking for earthquake precursor slip would go off all the time due to non-seismic processes.
The fact that most earthquakes in the study’s dataset do not show obvious precursor activity is consistent with the lack of foreshocks for most events: most big earthquakes are unheralded, as far as we can tell. But the two most prominent events in this study - the 2011-03-11 Tohoku earthquake and the 2010-04-04 El Mayor-Cucapah earthquake - both had dramatic precursory earthquake sequences. Even with such rich seismic data, we still don’t know how to identify foreshock sequences as foreshocks prior to the mainshock occurring. Plenty of interesting seismic events also do not herald a large rupture. It is not at all clear how a subtle, network-scale GPS signal could see through these ongoing seismic events and warn of an impending mainshock.
What should happen moving forward?
We are experts in earthquakes, but not geodesy (although we have both been very geodesy-adjacent over our careers, with some of our most brilliant colleagues being GPS wiggle nerds - a term of endearment in case it’s unclear). We therefore hope that our analysis is taken up and extended by more highly qualified scientists, and that a consensus can be reached about whether remaining noise in the time series negatively affects the conclusions of this paper. Our initial re-analysis does seem to show that some earthquake-related phenomena (e.g. foreshocks) might be present in time series stacked using the dot-product method, but it is not yet clear what the strengths or limitations of that approach are.
If the fundamental problems that we identify here are ultimately substantiated, the authors and the journal should ensure that any misunderstandings are corrected, as should the news sites that have reported on the results. Like medicine, the field of earthquake prediction studies needs bold new ideas, which are then held to a very high standard. We do recognize that the kind of detailed critical review we have done here is usually moderated through a comment and reply setting overseen by the publishing journal, and that in this post we are sidestepping that process. However, the goal of our Substack is to provide timely and in-depth analysis of recent earthquakes and papers to improve general understanding of earthquakes, and if you have made it this far, dear reader - thanks!
Caveat Emptor
We have not contacted the authors of the paper regarding their analysis or our re-analysis. We are ‘flying solo’ on this one and sincerely hope that we haven’t messed up something important! We present only a rough analysis that modifies the input data to the provided scripts in order to try to remove significant oscillatory noise from the data stacks. Our approach has not been peer reviewed or extensively checked, and it’s possible that our approach is actually flawed. However, the recovery of mostly linear signals after subtraction of the noise time series is encouraging. So hopefully we aren’t too off-base!
Our code and instructions for using it are available at Github.
References:
Bletery, Q. and Nocquet, J.M., 2023. The precursory phase of large earthquakes. Science, 381(6655), pp.297-301. https://doi.org/10.1126/science.adg2565
Blewitt, G. and Hammond, W., 2018. Harnessing the GPS data explosion for interdisciplinary science. Eos, 99.https://doi.org/10.1029/2018EO104623.
Yao, D., Huang, Y., Peng, Z. and Castro, R.R., 2020. Detailed investigation of the foreshock sequence of the 2010 Mw7. 2 El Mayor‐Cucapah earthquake. Journal of Geophysical Research: Solid Earth, 125(6), p.e2019JB019076. https://doi.org/10.1029/2019JB019076








Another problem with using the Nevada Geodetic Laboratory products is that they apply a symmetrical smoothing filter to the data, so the large signals of the coseismic displacements are partially smoothed backwards in time. Angelyn Moore pointed this out.
It is also not clear whether the observation in the lab and that derived from GPS are comparable. Lab-based slip measurement often relies on a single site near one edge of the fault. It is implicitly assumed that the measured slip is homogeneous over the entire fault, which has been shown invalid by array- or digital-image-correlation(DIC)-based slip measurement. On the other hand, GPS measures the deformation at the Earth's surface, which could sample a large volume of deformation signals at depth (cross-talk effect, convolution effect, etc.).