The great tidal earthquake hypothesis test, part II
Let's review global studies comparing earthquakes to tidal forcing
Citation: Hubbard, J. and Bradley, K., 2024. The great tidal earthquake hypothesis test, part II. Earthquake Insights, https://doi.org/10.62481/2c56f873
This is the second in a series of posts about whether earthquakes are influenced by tidal forces - and whether such influence might be able to tell us about upcoming large earthquakes.
In this post, we read and discuss the results of well-cited, peer-reviewed research papers that explore links between seismicity and tidal stresses at global scales. In follow-on posts, we will replicate the methods of some of these papers, and test them using data from earthquakes that occurred after their publication. We will then explore variations in tidal seismicity with time, and look at some special tectonic cases. We encourage you to revisit our first post in this series, which explains some of the theory, as a guide.
Do earthquakes preferentially happen during specific phases of the moon, or during lunar-solar alignments, or at other times related to the tidal cycle?
These kinds of questions predate the development of modern seismology. Many research papers have examined these questions - looking at the problem for many regions, for many time periods, for many types of stresses, and for many classes of earthquakes.
In this post, we will examine a few of the most influential recent studies that searched for evidence of tidal triggering using global earthquake datasets. While we are obviously interested in the details of the science, we also want to understand how conclusions have propagated through the literature over time.
We start with the oldest paper and then move forward in time - briefly summarizing the methods and conclusions, without providing any critical analysis.
As we go, we also build up a chart that keeps track of what the studies actually looked at, and which correlations they 1) observed, 2) did not observe, or 3) didn’t examine. Because most of these studies use similarly defined statistical p-values, we can keep track of relative confidence levels. We build ✨The Chart✨, in which p-values above 5% are marked in orange (not statistically significant); p-values between 1-5% are in yellow, and p-values below 1% are in green. (Recall that the p-value broadly represents the probability that a set of data is random - the lower the p-value, the more likely that there is some actual effect.)
At the end, we will compare the results of different studies, and then we will indulge in some further reflections on the individual studies.
So, let’s get started. We begin with an early study by seismologist Tom Heaton, then a graduate student at Caltech.
Heaton, T.H., 1975. Tidal triggering of earthquakes. Geophysical Journal International, 43(2), pp.307-326. https://doi.org/10.1111/j.1365-246X.1975.tb00637.x
Google Scholar citations: 321
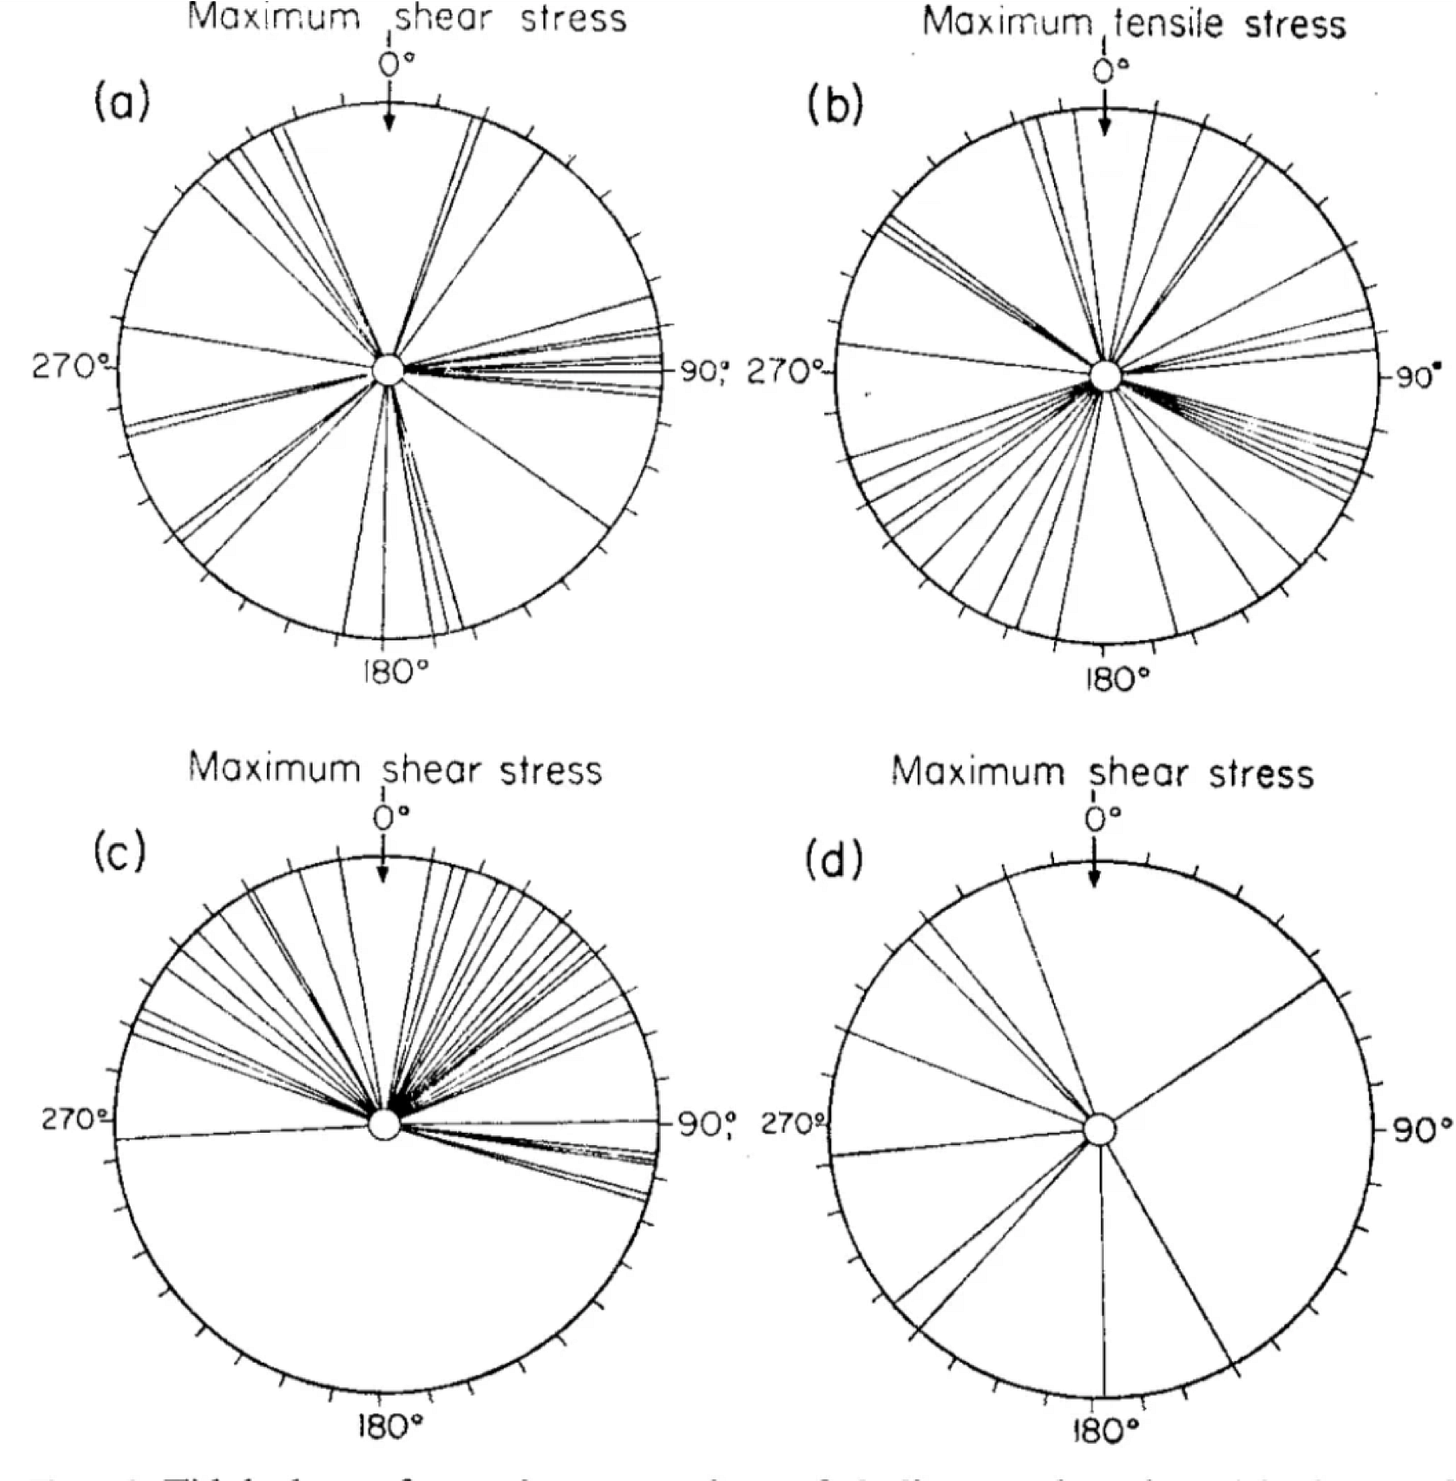
Heaton (1975) calculated the stress from the solid earth tide alone to determine the phase of the shear stress (Δτ) and something he called the tidal hydrostatic stress, which is similar to the change in volume, ΔV. (If these symbols don’t mean anything to you, revisit our first post.) By applying Schuster’s test (again, see our first post) to the resulting dataset (107 earthquakes), he determined that there was no obvious correlation - unless he divided the earthquakes by type, at which point it became clear that the vast majority of shallow earthquakes with dip- or oblique-slip occurred when the tidal shear stress promoted slip. The very low p-value for this correlation (p=0.001%) is evident in panel C in Figure 1 below - the lines are clearly not equally distributed around the circle.
This is our first example of a claim that a low p-value is evidence for a clear tidal forcing of (some) global earthquakes - an exciting result!
And thus ✨The Chart✨ begins:
The study above was subjected to a critical test, by seismologist Tom Heaton, PhD at the US Geological Survey.
Heaton, T.H., 1982. Tidal triggering of earthquakes. Bulletin of the Seismological Society of America, 72(6A), pp.2181-2200. https://doi.org/10.1785/BSSA07206A2181
Google Scholar citations: 178
In 1982, Heaton revisited his 1975 study, with an additional 222 earthquakes, and expanded the study to also consider the normal stress (Δσ). The result? He found no correlation between earthquakes and the solid earth tide, for Δτ, Δσ, or ΔV, even looking at subcategories of earthquakes (dip-slip vs. strike-slip, shallow vs. deep). His previously positive result - which had such a low p-value - did not hold up to the new data. The new data were presented as rose diagrams - the most floral of all diagrams (Figure 2).

These two papers stand out in our experience - it is actually quite rare in science for someone to subject their prior work to a new test, and to then publish the negative result and discuss the factors that led to their believing the first result.
It also is interesting (and a bit concerning) how Heaton (1975) and Heaton (1982) are sometimes cited positively in introductory paragraphs of more recent papers... despite one being a clear test and negative result of the other.
Let’s add the results to ✨The Chart✨.
The next paper, by Stephen Hartzell and Tom Heaton at the USGS, tried to test things in a different way.
Hartzell, S., and Heaton, T., 1989. The fortnightly tide and the tidal triggering of earthquakes + Erratum. Bulletin of the Seismological Society of America, 79(4), pp. 1282-86. Available at: https://authors.library.caltech.edu/records/39ffh-nrm98
Google Scholar citations: 72
Although Heaton had previously looked at tidal phase, in this study he worked with Stephen Hartzell to examine tidal stresses from a different perspective: fortnightly periodicities. (A fortnight is simply a period of fourteen days.)
Why do this? Tides do not just repeat in the same way day after day. Instead, the interference of the primary solar (1 peak per 12 hours) and lunar (1 peak per 12 hours and 25 minutes) tides leads to pulses in tidal strength - with the strongest tides occurring approximately every two weeks, when these two periodicities line up constructively. This plot of tidal shear stress around the time of the 26/12/2004 earthquake in Sumatra illustrates that pattern (Figure 3, taken from Ide et al., 2016, which we discuss later in the post).

The idea that Hartzell and Heaton had was this: if earthquakes are triggered by tides, they should be more triggered at times when the tides are strongest. Those times occur like celestial clockwork: every 14.765 days. (Initially, the authors looked at a period of 13.6626 days; the corrected timing is considered in their Erratum. Once again, we admire the willingness to go back and correct the record.) For comparison’s sake, they also considered periods of 1 day and 365 days, and both a regional (USGS-CALTECH southern California network, N=151,834) and global (NEIC, N=189,385) catalog.
What they found was initially very surprising: incredibly low p-values for both southern California and globally - not just for the fortnightly tide, but for the 1-day and 365-day periods! For instance, they found, with a p-value of 7.52e-107% (106 zeroes after the decimal point) that earthquakes in Southern California were correlated with the day of the year. Recall that a p-value of 1% is usually considered to indicate a meaningful correlation.
How can we make sense of this? It turns out that those periodic signals have well understood, non-tidal sources. The data don’t look random, because they aren’t random. Earthquake catalogs integrate many patterns - including both aftershocks and swarms, which we discussed briefly in post 1. The low p-value is real: the data are not random. However, the dependency is not necessarily due to tides. The correlation with fortnightly periods is subject to the same influence.
Aftershocks can be managed through declustering - removing events thought to represent aftershocks of other earthquakes. When Hartzell and Heaton declustered the Southern California catalog (about 80% of the earthquakes were identified as likely aftershocks), that ultra-low p-value increased by 102 orders of magnitude, to the still-low value of 0.0000966%. When they further applied a magnitude cutoff of M2.5 - removing incomplete parts of the catalog - the correlation disappeared: the p-value had once again increased by orders of magnitude, to 12.6%.
What about the fortnightly tide? Here, an initial correlation in the Southern California catalog (p-value=0.00000000157%) was removed by declustering (p-value=27-51%, depending on the magnitude cutoff).
What about global data? The global catalog showed periodicities at all three periods: 1-day (p-value=0.0000786%), 14.765 days (p-value=0.14%), and 365 days (p-value=0.000000000000701%). Hartzell and Heaton were not able to decluster the global catalog, because the code that existed at the time did not work on a catalog without small enough events. Instead, they showed that the 1-day and 365-day periods disappeared with a minimum magnitude cutoff of 5. This minimum magnitude did not eliminate the fortnightly signal - but when they divided the dataset into different time windows, only the part of the catalog after 1976 remained correlated, and the timing did not match the times of the strongest tides.
The authors concluded that the apparent correlations were spurious.
Clustering of earthquakes in aftershock sequences, lower magnitude completeness levels, and insufficient number of sampling cycles can all lead to erroneous periodicities.
A new addition to ✨The Chart✨:
At this point, other groups of scientists were tackling the problem, using more powerful computers and larger earthquake catalogs.
Tsuruoka, H., Ohtake, M. and Sato, H., 1995. Statistical test of the tidal triggering of earthquakes: contribution of the ocean tide loading effect. Geophysical Journal International, 122(1), pp.183-194. https://doi.org/10.1111/j.1365-246X.1995.tb03546.x
Google Scholar citations: 220
In 1995, Tsuruoka et al. took on the challenge of incorporating ocean tides into stress calculations. This was an important step, because ocean tides can be a much more significant source of stress than the solid tide for the shallow submarine faults that produce many of Earth’s large and dangerous earthquakes.
For a dataset of 988 large (M6+) earthquakes from the Harvard CMT catalog (the predecessor to the modern GCMT catalog), the authors calculated the stresses induced by the combination of solid earth and ocean tides. They calculated the phase of stress acting in a variety of orientations, including Δτ as well as some more obscure components, like the stress along various axes of the earthquake focal mechanisms - the T-, N-, and P-axes. They also examined the cubic stress component, which is the same as ΔV.
Because they were working with a large focal mechanism database, each earthquake had a fundamental ambiguity: there were two possible fault planes. While Heaton selected the correct plane for each earthquake based on geological understanding, Tsuruoka et al.’s larger catalog contained many faults for which the correct plane could not be determined, or even guessed at. They chose to ignore any stress components that required choice of a fault plane, such as Δσ or ΔCFF.
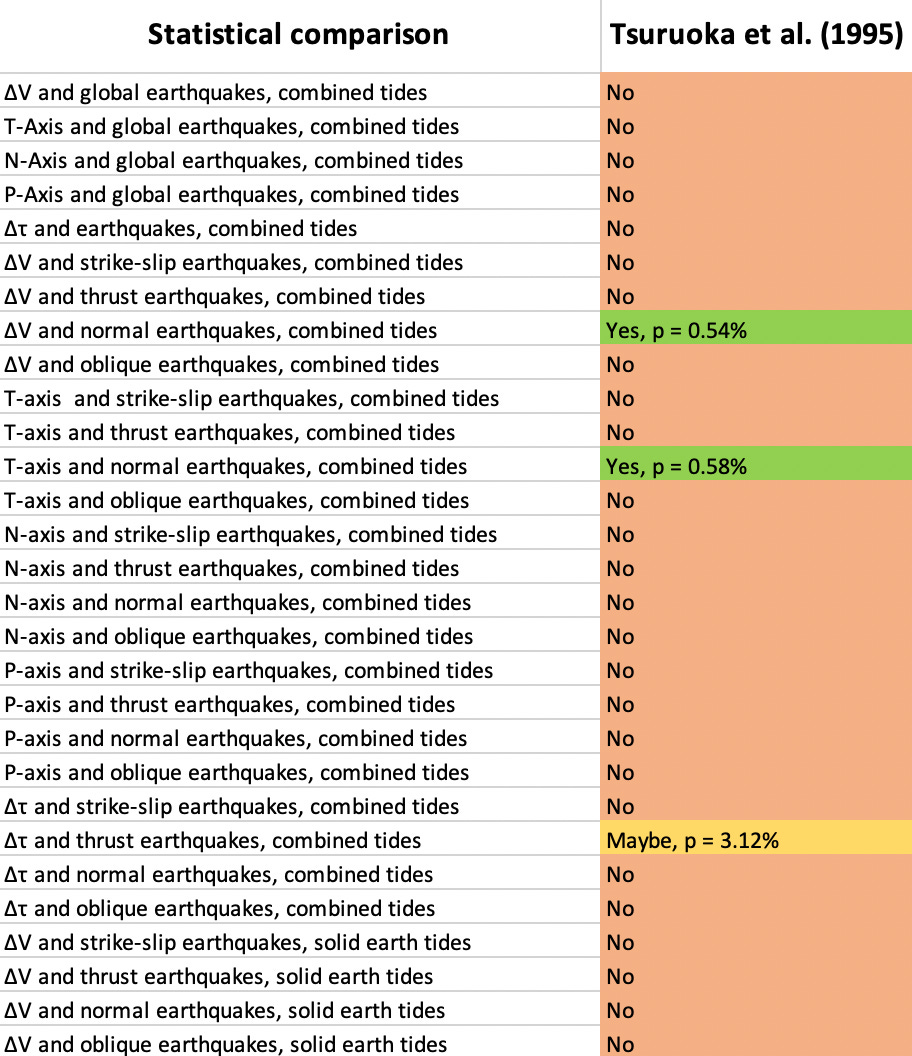
What did Tsuruoka et al. find? After making many plots and calculating many p-values, they concluded that there was no statistical relationship between any these parameters for strike-slip earthquakes. For thrust earthquakes, there was a tentative correlation between earthquakes and shear stress (Figure 4, top right). Normal-type earthquakes also stood out: they correlated with both ΔV (Figure 4, bottom left) and the stress along the T-axis. Note that the visual variability in the histograms results from the low number of events of each type, and is more prominent for low N samples.
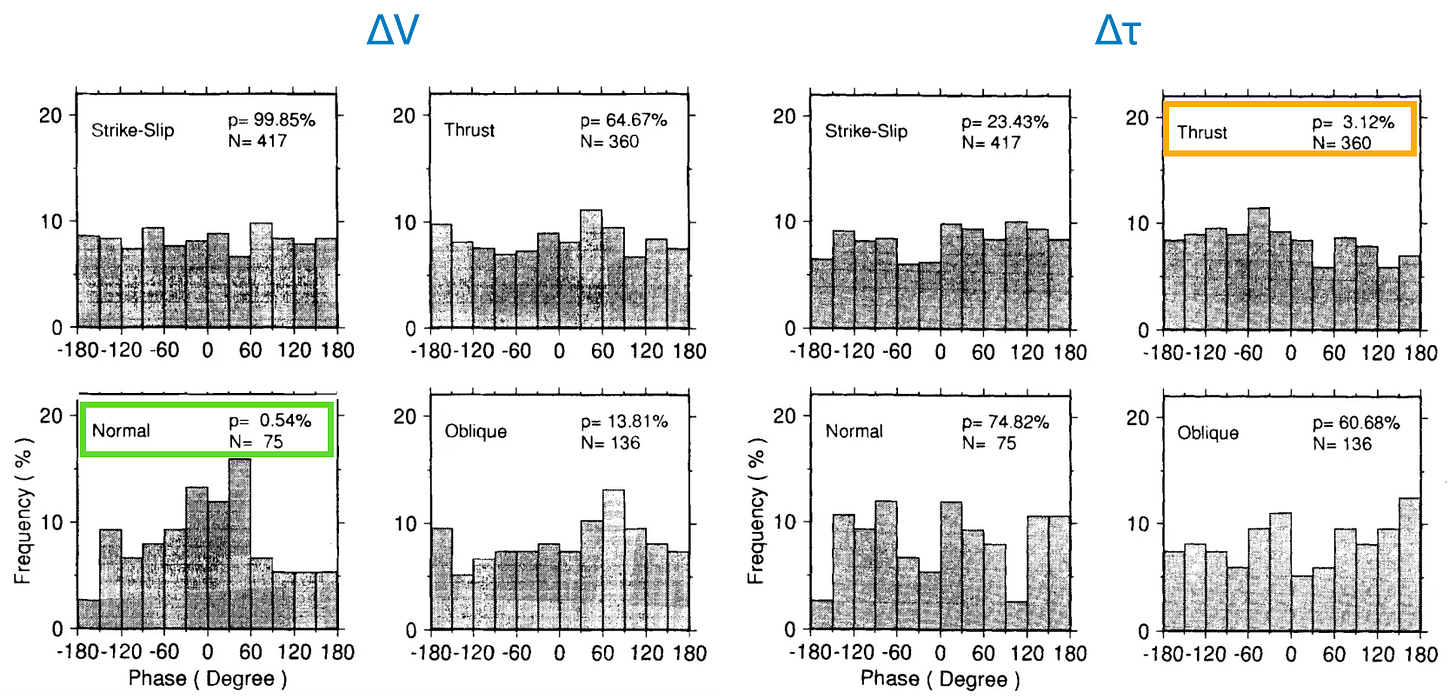
Their conclusion: A small but significant proportion of normal-mechanism (extensional) earthquakes were triggered by tides, but not strike-slip earthquakes; thrust earthquakes were still up in the air.
✨The Chart✨ in this case is a bit long - reflecting the variety of tidal parameters explored.
Tanaka, S., Ohtake, M. and Sato, H., 2002. Evidence for tidal triggering of earthquakes as revealed from statistical analysis of global data. Journal of Geophysical Research: Solid Earth, 107(B10), pp.ESE-1. https://doi.org/10.1029/2001JB001577
Google Scholar citations: 235
Tanaka et al. (2002) also used the Harvard CMT catalog - but where Tsuruoka et al. studied 988 M6+ earthquakes, Tanaka et al. looked at 9,350 M5.5+ events. (Ongoing improvements in global networks have led to an accelerating rate of focal mechanism determinations. This means that later studies have had access to much more data than prior studies, with increasingly lower magnitude events being included in studies.)
Tanaka et al. calculated Δτ and ΔV (which they call J1 - why is the terminology for an invariant of the stress tensor is so…. variable???). They then sliced and diced the dataset into progressively tinier pieces as they investigated the relationships between tidal triggering and magnitude, depth and earthquake type.
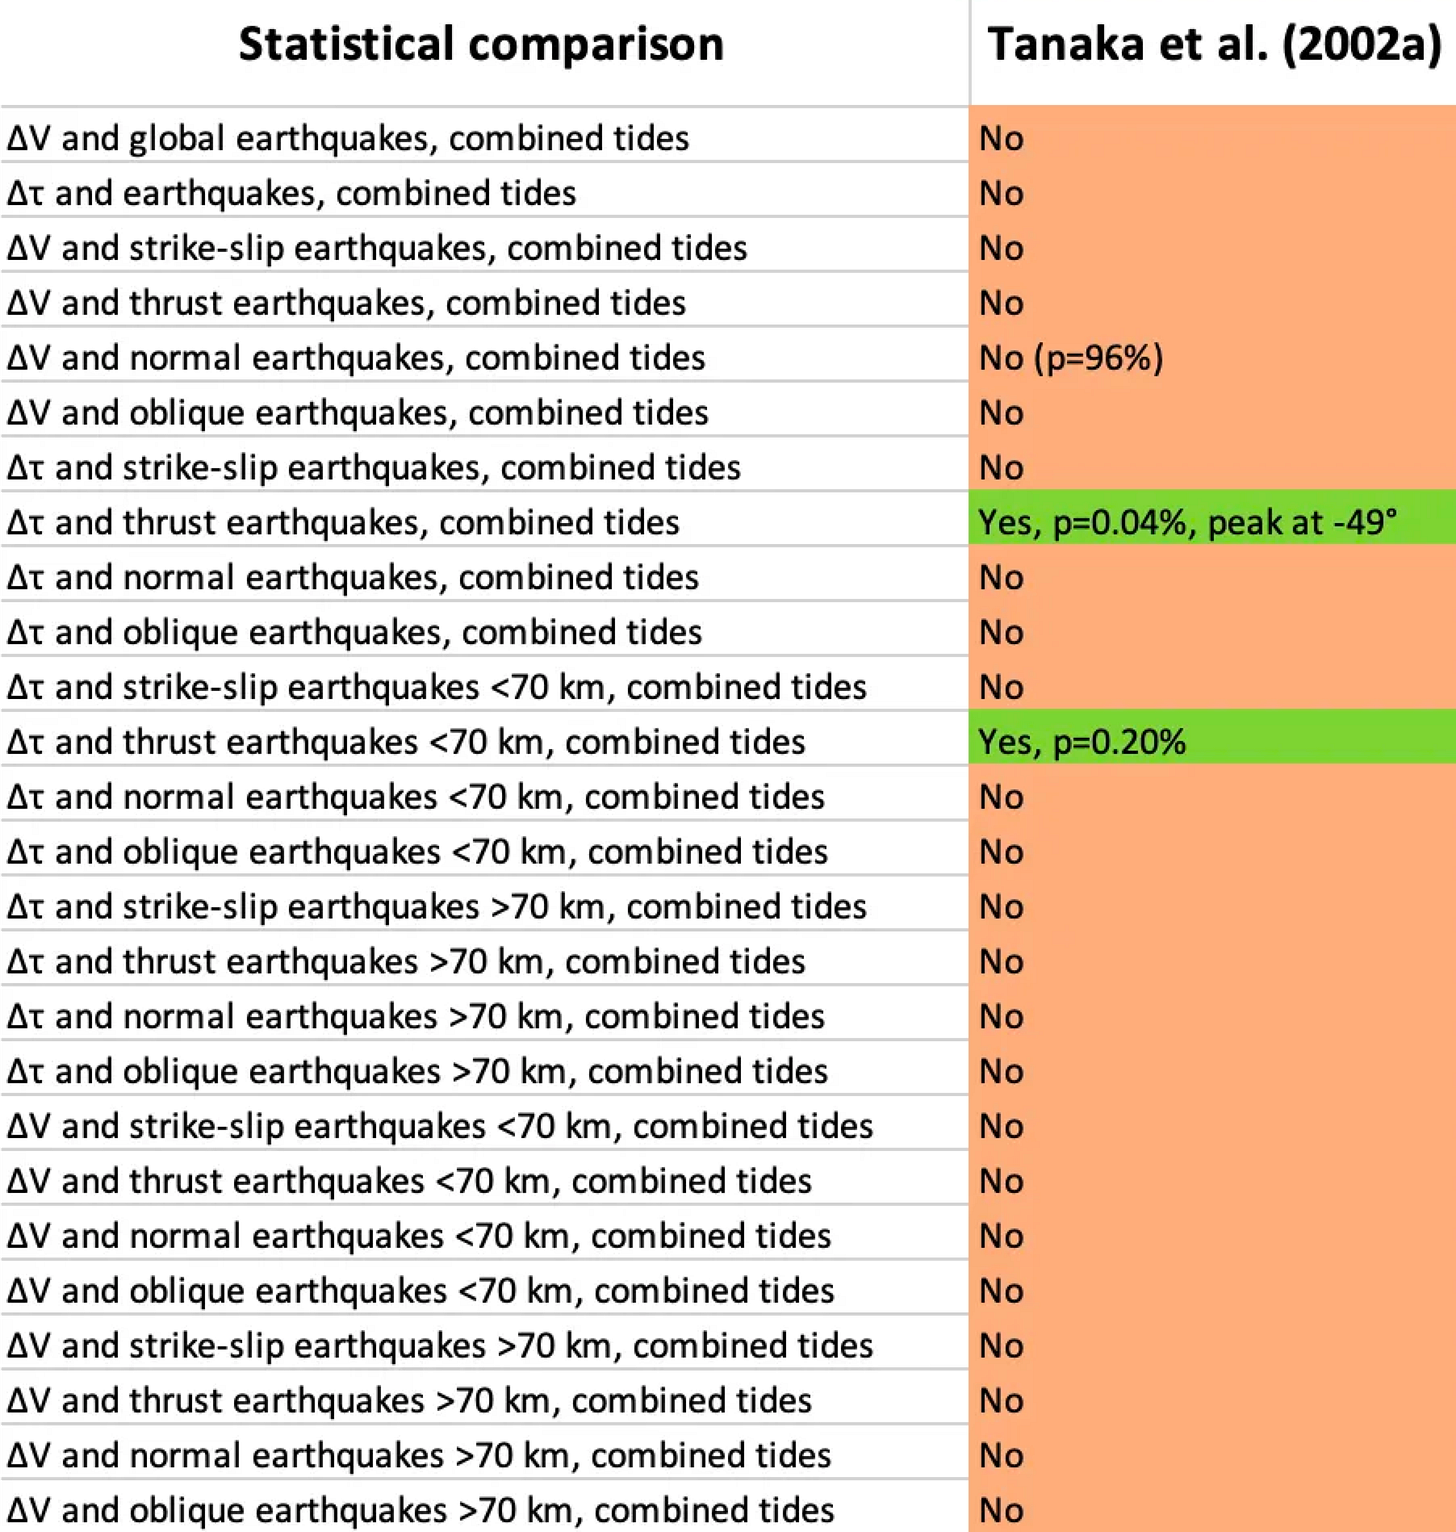
Out of these various statistical efforts, Tanaka et al. found only one strong correlation: between thrust earthquakes and Δτ, with p=0.04%, and a peak phase of -49° (Figure 5, green box). Tanaka et al. also divided the earthquakes into shallow (<70 km) and deep (>70 km) events. The correlation between Δτ and thrust earthquakes disappeared for the deep earthquakes, and for earthquakes above M6.5.

The authors also reported a tentative correlation between ΔV and a subset of normal earthquakes: those that were shallower than 70 km, and had magnitudes between 6 and 7 (p=2.1% and 3.8% for different magnitude ranges).
Finally, the authors re-tested their “Yes” and “Maybe” results with another variable - J1’ (J1 prime, not to be confused with Optimus Prime). J1’ is the horizontal component of J1. They discovered four “Maybe” relationships for certain magnitude subdivisions of these categories.
Behold the additions to ✨The Chart✨: first, the general categories, and then in much smaller text, the highly subdivided categories:
Cochran, E.S., Vidale, J.E. and Tanaka, S., 2004. Earth tides can trigger shallow thrust fault earthquakes. Science, 306(5699), pp.1164-1166. https://doi.org/10.1126/science.1103961
Google Scholar citations: 421
Cochran et al. (2004) looked once more at global earthquakes, now using GCMT focal mechanisms. They focused specifically on shallow thrust earthquakes, which are expected to experience the most stress change due to tides, and which were highlighted by Tanaka et al. (2002).
The authors calculated Δτ, Δσ, and for the first time, ΔCFF for three different values of friction (0.2, 0.4, 0.6). Recall that ΔCFF should be the most meaningful if tidal stresses are actually triggering the earthquakes by overcoming frictional resistance to sliding, because it specifically tells us how a given combination of Δτ and Δσ makes the fault more or less likely to slip. (Read more about this in our first post.)
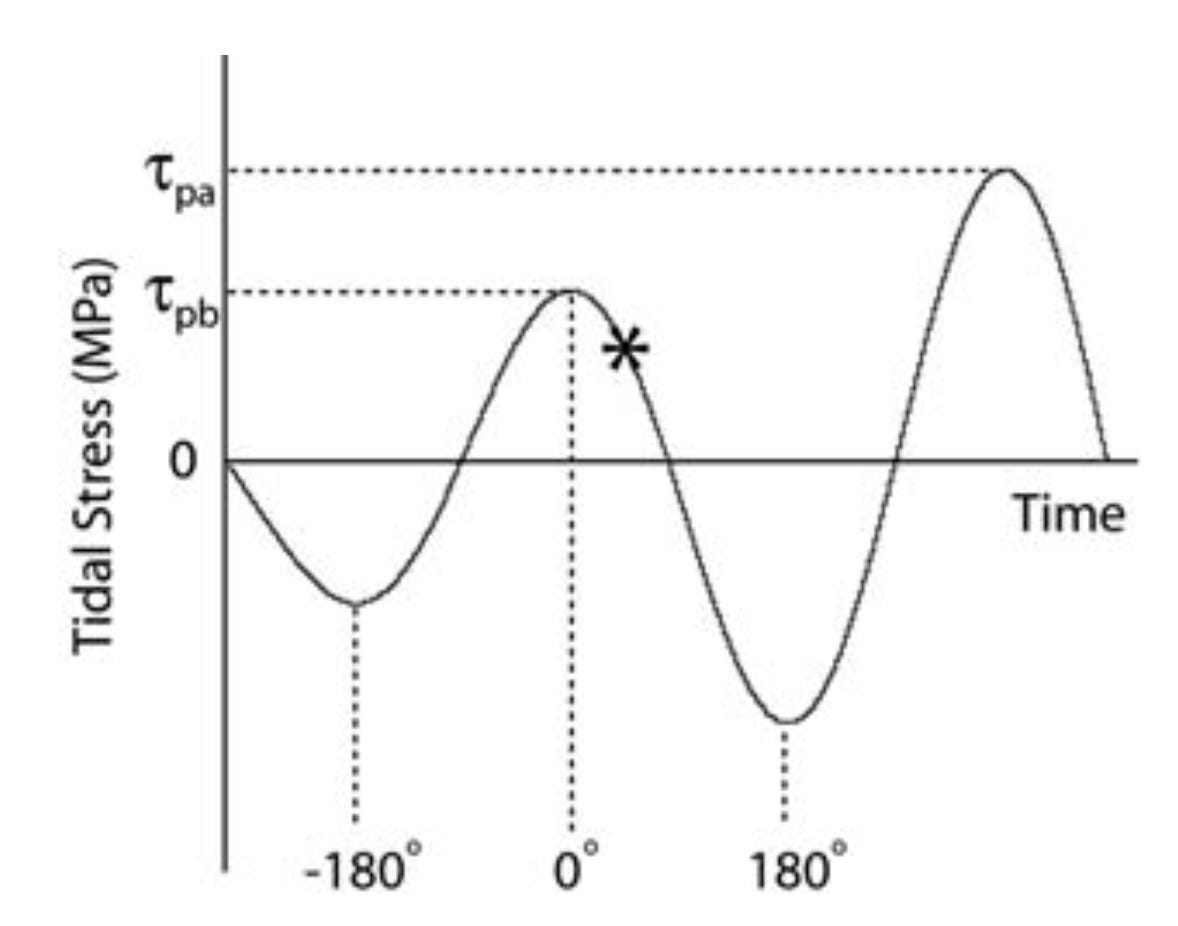
The authors took a further step: they filtered the dataset to include only events that occurred when tidal forcing was particularly strong - not specifically strong at the moment of the earthquake, but strong during that particular tidal cycle. They selected these earthquakes by calculating a new parameter, τp, which represents the average of the maxima on the stress curve on either side of the earthquake time (Figure 6). This approach allowed them to discard events that occurred when the tidal cycles were unlikely to have much effect.
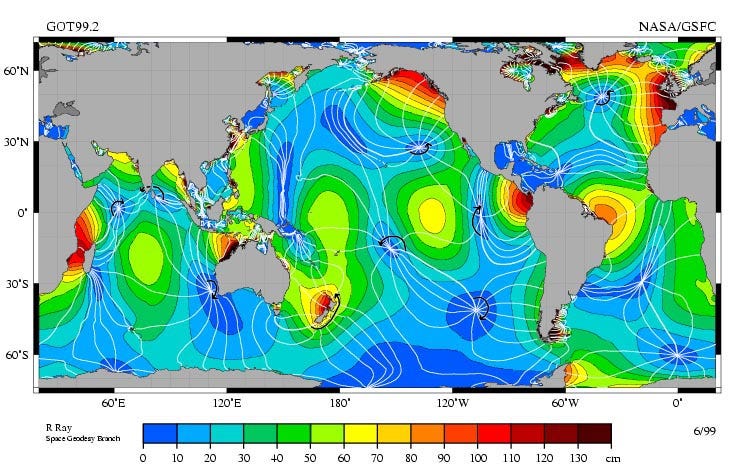
It is important to note that this τp selection filter is also a spatial filter, selecting only events that fall within areas of very large tidal range - mostly near coasts, and avoiding areas of the ocean where the tidal range is always low due to ocean-scale resonances (Figure 7).
Cochran et al. did find a correlation between earthquakes and tidal stresses - but only when they combined Δτ and Δσ to determine the Coulomb Failure Function (ΔCFF) (Figure 8a); of the friction values they tested, μ=0.4 gave them the strongest correlation.
To evaluate the importance of this newly discovered tidal effect, they calculated a new number - the excess events - that was intended to reflect how many extra earthquakes occurred during times when the tides encouraged, rather than discouraged, slip (i.e. when the phase was between -90° and +90°). If earthquakes are random, then half of them on average should have a value in this range; the percentage of excess events simply tells us how much higher that number is than 50%. They proposed that there should be more excess events during times when the tidal variations are large - and indeed, that is what they found (Figure 8b):

Let’s return to ✨The Chart✨:
Métivier, L., de Viron, O., Conrad, C.P., Renault, S., Diament, M. and Patau, G., 2009. Evidence of earthquake triggering by the solid earth tides. Earth and Planetary Science Letters, 278(3-4), pp.370-375. https://doi.org/10.1016/j.epsl.2008.12.024
Google Scholar citations: 167
So far, the studies we have described followed certain basic rules: most of them calculated total tidal stresses using similar methods, and then compared the phases of those stresses - either within the rock body surrounding the fault, or on the faults themselves - to the frequency of earthquakes.
Enter Métivier et al. (2009). The authors of this study didn’t like the use of tidal phase for combined tidal signals, because:
actual tidal signals present various periodicities (annual, monthly, diurnal, semi-diurnal, ter-diurnal), which means that tidal phases determined by interpolation do not have the same meaning for all the earthquakes.
It is certainly true that tidal phase is a weird parameter, especially if the more minor tidal components are included in the modeling of the tides. In some cases, small fluctuations in tidal stress can ‘reset’ the phase in unexpected ways.
The solution, the authors said, was to calculate the tidal stresses for different periodicities and compare them separately. Furthermore, rather than estimating the stresses on the fault, they decided to look only at the movement of the ground surface above the earthquake. When the ground moves up, they said, this should depressurize the rocks below, making it easier for the fault to slip.
To do this, the authors used a different code for calculating tidal stress than most other studies - one that implemented a more realistic Earth model, including viscoelastic deformations that are distributed across the entire Earth. From these tidal stresses, they calculated the change in gravity that you would expect to see, and the resulting surface displacement (how far up-and-down the ground surface actually moved). This surface displacement is the tidal parameter they used for comparison, for tides with diurnal (once a day) and semi-diurnal (twice a day) cycles.
Because surface displacement does not depend on the focal mechanism of the earthquake, the authors could expand their catalog dramatically - to the 442,412 events then included in the NEIC catalog, which spanned a much greater range of magnitudes than prior studies.
However, since their calculation of stress included only the solid earth tide, they limited the dataset to events within the continents, to avoid the issue of ocean tide stresses. This yielded a final dataset of 175,495 earthquakes - still more than an order of magnitude greater than that considered by Tanaka et al. (2002).
So, what did they find? A statistically meaningful but extremely subtle correlation between earthquake rates and tidally driven surface displacement, apparently caused by ~0.2-0.3% of all earthquakes in the database being tidally influenced (Figure 9). When they investigated the correlation by subdividing their catalog by depth (shallower or deeper than 20 km) and magnitude (less than or greater than M4), they found that the signal arose from a specific group: small magnitude, shallow earthquakes.

No correlation was observed for M4+ earthquakes, which are the events discussed in all of the previous studies in this post.
Here is ✨The Chart✨, once again.
Ide, S., Yabe, S. and Tanaka, Y., 2016. Earthquake potential revealed by tidal influence on earthquake size–frequency statistics. Nature Geoscience, 9(11), pp.834-837. https://doi.org/10.1038/ngeo2796
Google Scholar citations: 99
The next paper we will look at goes back to Δτ.
Ide et al. (2016) noted that a relationship had been identified between seismic tremor on the deep parts of faults and tidal stresses. This tremor tells us something about slow fault movement at depth, would could conceivably promote the occurrence of earthquakes on the shallower, frictionally stuck parts of faults. Because tremor occurs over a long time period (days to weeks), they proposed that we should not look at instantaneous stresses - instead, it is better to look at longer time periods, like one day.
To apply this idea, they looked at the 15 days prior to an earthquake, and calculated the maximum Δτ on each of those 15 days. They determined the maximum Δτ on the last day - just prior to the earthquake - and ranked it, from 1 (smallest) to 15 (highest). Here is what they found, for a dataset of 11,397 GCMT earthquakes with magnitude >5.5 and maximum depth of 100 km, divided into different bins based on different magnitude cutoffs (Figure 10):

The panels show that when the dataset was filtered to larger magnitude earthquakes (left hand side), the tidal stresses skewed towards higher rankings. The effect was strongest for the largest magnitude earthquakes (M>8.2), a result that applied to a total of twelve earthquakes. (Actually, their Supplementary Figure 1 suggests that this plot may actually represent Mw>8.1.)
(Note: we don’t really understand, or rather really don’t understand, the shape of the histogram for all events (panel D). Ide et al. state that this is the shape we should expect for random events, but our intuition is that the histogram should be flat. We will investigate this further in future posts on this topic; any advice from the crowd is also welcome!)
This paper also looks at other phenomena that are not easily related to the other studies we discuss here - so we won’t include those at this point.
Here is the contribution to ✨The Chart✨:
Hough, S.E., 2018. Do large (magnitude≥ 8) global earthquakes occur on preferred days of the calendar year or lunar cycle?. Seismological Research Letters, 89(2A), pp.577-581. https://doi.org/10.1785/0220170154
Google Scholar citations: 17
We arrive at the final paper of this post.
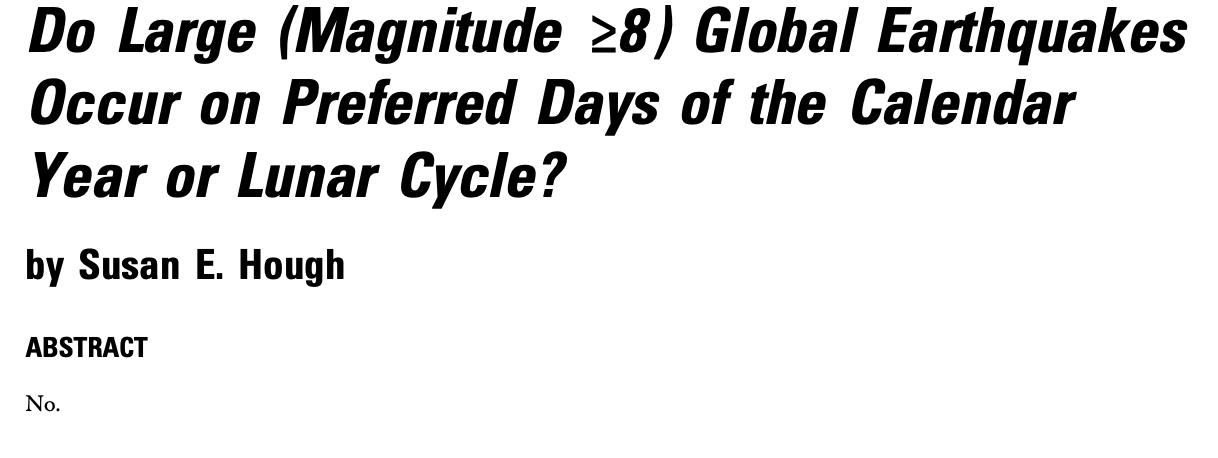
Hough (2018) is famous in seismological circles for its briefest of abstracts: a direct answer to the question posed by the title.
It seems like the only path forward is for someone to publish a single-author paper with a single-word title, a single-word abstract, and only one reference...
Inspired by Ide et al. (2016), Hough tested the hypothesis that M8+ earthquakes are correlated with either the lunar cycle or the solar cycle.
Because Hough was looking at only very large (M8+) earthquakes, she was able to expand her catalog well beyond the instrumental record using historical events, including events as far back as 1600 CE. This grew the catalog to 214 earthquakes.
She did find some apparent clustering in the data. However, when she compared the catalog to random catalogs with the same number of events, it became clear that this kind of clustering was a natural outcome of random data (Figure 11).

In the end, Hough indicated that there was a statistically inconclusive modulation of large earthquakes by lunar date, with perhaps ~0-5% additional earthquakes on specific days. However, there is no known physical process that would produce a high density of events on one lunar date but a low number in the days prior or after.
Because one M8+ event is added to the catalog each year on average, it is extremely unlikely that future large events will allow us resolve a signal of this magnitude (should it exist) during our lifetimes.
Our addition to ✨The Chart✨ is short but sweet:
Reflections on global tidal earthquake studies
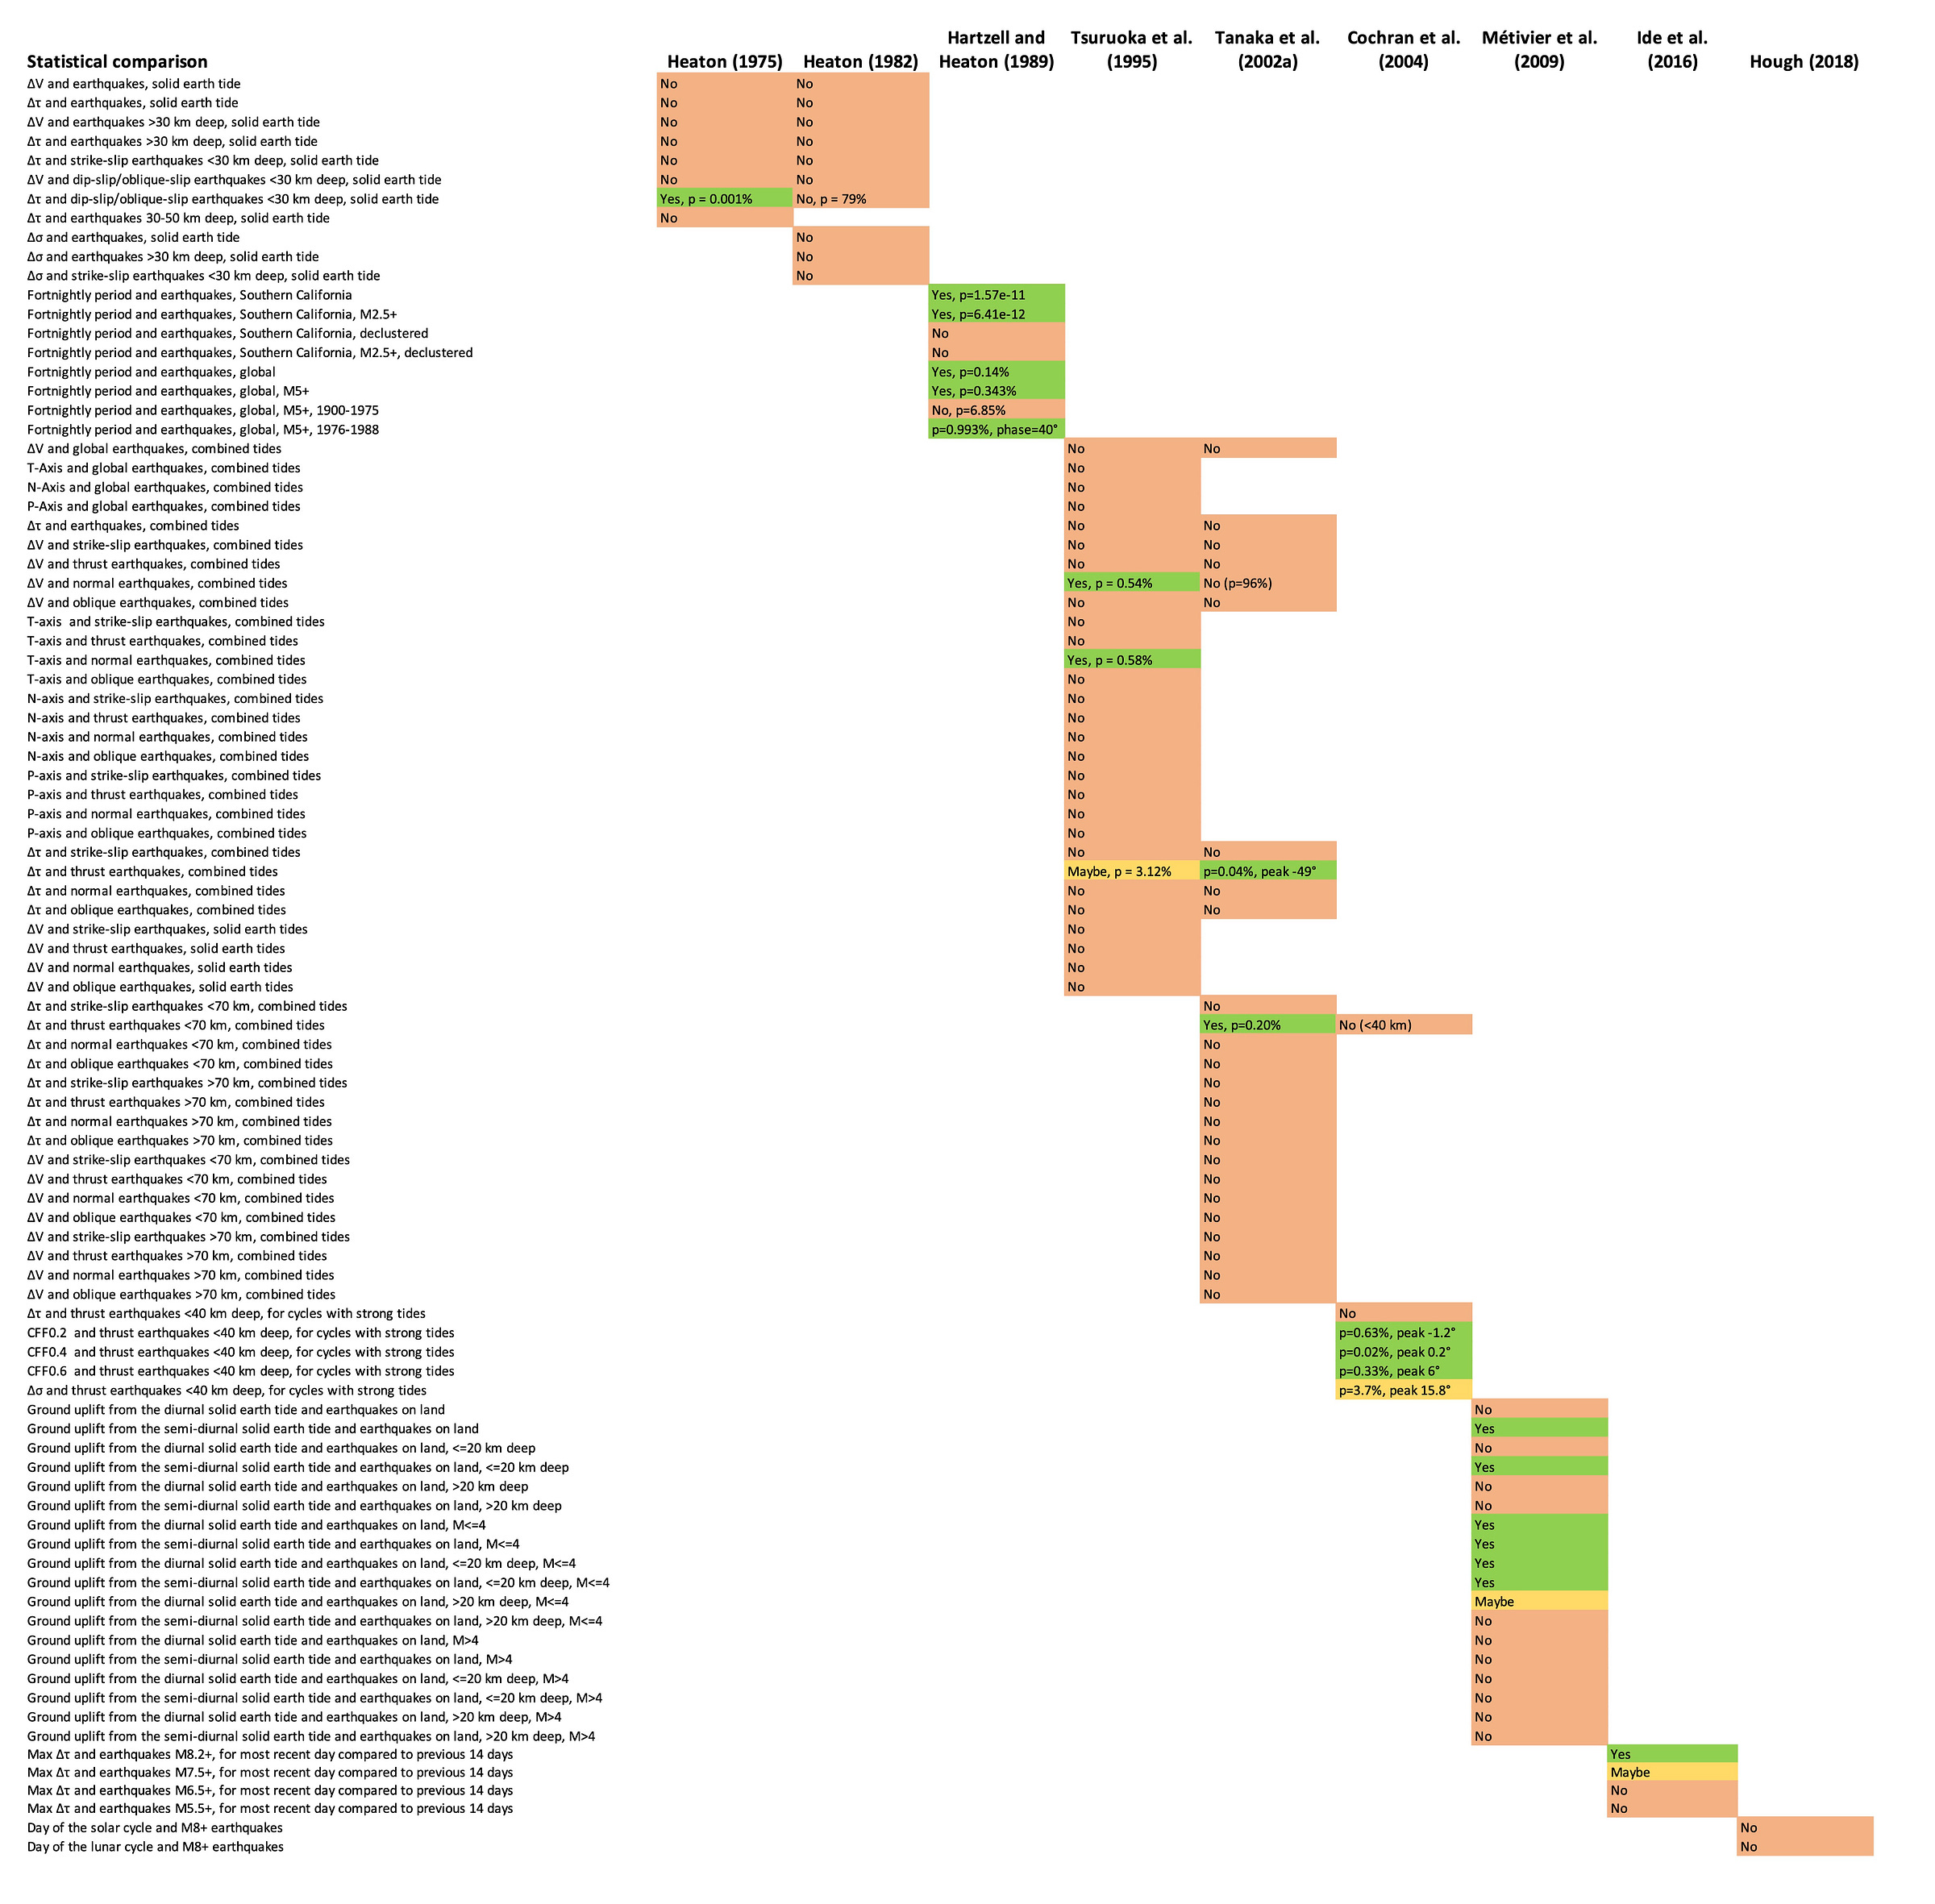
Where does this leave us? First things first: let’s look at ✨✨✨The Chart✨✨✨ in its almost full glory (for the obvious reason, we have left out about 100 lines from Tanaka et al., 2002).
While you are welcome to zoom in, our main points are about the overall structure of ✨The Chart✨, which you can see without zooming.
First, studies very rarely replicate each other’s methods closely enough to allow direct comparison. This is why the chart has so few entries on the same row.
Second, when aspects of one study are sufficiently replicated to allow comparison, the earlier results often do not hold up. These can be seen where the chart has a green (“Yes”) cell followed by “No” cell. Here are some examples of these contradictions:
Heaton (1982) directly contradicted Heaton (1975) on the topic of correlation between Δτ from the solid earth tide and dip-/oblique-slip earthquakes.
Whereas Tsuruoka et al. (1995) found a correlation between ΔV and normal earthquakes, Tanaka et al. (2002) found no such correlation.
Whereas Tanaka et al. (2002) found a correlation between Δτ and shallow thrust earthquakes, Cochran et al. (2004) found no such correlation.
Whereas Ide et al. (2016) found a correlation for large (M>8.1 or 8.2) events, Hough (2018) found no correlation between M8+ events and either lunar or solar cycles for a significantly larger catalog.
This tendency toward non-replication has not really been discussed in the literature, but it clearly arises in part from the low sample number of the earliest studies.
Third, only one proposed correlation has been upheld by a subsequent study: Δτ for thrust earthquakes, found by Tsuruoka et al. (1995) (N=360 events, M>6) and confirmed by Tanaka et al. (2002) at higher confidence (N=2823 events, M>5.5). This is perhaps the most commonly cited result - and is a great candidate for further testing.
Fourth, there are about 20 “Yes” or “Maybe” cells, where significant correlations were found, that have yet to be directly tested by any other study. Are they reliable?
Fifth, of those still-untested results, in no case was the proposed correlation found to be responsible for a large number of excess earthquakes. Métivier et al. (2009) found an effect of 0.2-0.3%. While Tanaka et al. (2002) did not calculate the number of excess earthquakes, the mostly flat histograms indicate that the number is small. Cochran et al. (2004) found that a global dataset of shallow thrust earthquakes had about 0-2% excess events. Hough (2018) found an excess of 0-5% of M8+ earthquakes, and noted that this is too small a number to be meaningful given the catalog size. Only when datasets are sliced-and-diced to very small number of earthquakes (Ide et al., 2016; Cochran et al., 2004) does this percentage increase to more impressive values. Of course, when N is small in those slices-and-dices, the reliability and applicability of these results comes into further question.
So, that’s our own understanding of the current state of claims for global earthquakes. If we have missed some important results or mis-understood something, we are happy to correct the record!
However, we are still not done. Are the methods and data in these papers sufficiently good for us to simply accept the correlations as real, or are there potential issues that might impact the reliability of the results?
After reading these studies, we have found that there are several factors that should definitely be considered for all global tidal earthquake studies. If a study did not address one or more of these factors, then in our opinion it remains an open question whether the proposed correlation is even present in the data.
Factor 1: Location uncertainty and variability of tidal stresses
If tidal stresses are calculated for the wrong location, for one reason or another, then the derived tidal phase and tidal stress magnitude are likely “wrong.” We put “wrong” in quotes because all of these calculations are entirely theoretical - we have no measurements of actual stress changes on earthquake faults. We also don’t know whether tidal stress changes are supposed to trigger earthquakes, in which case the relevant location is the initiation point, simply allow them to grow to greater magnitude, in which case other parts of the fault may be important, or even suppress the nucleation of earthquakes.
However, we do know that tidal stress is spatially variable, especially around coastal regions. Because earthquake locations are not perfectly known, there is a fundamental uncertainty in tidal phase that is not reflected in any of these studies and has never actually been quantified. This problem is exacerbated by the persistent origin-centroid biases in global focal mechanism catalogs (read about this in our previous post).
Of the studies we have described, we know that Ide et al. (2016) used centroid, rather than origin, locations, as described by the locations listed in their Supplemental Figure 1. Given the physical mechanism they propose, centroids may be more appropriate, but those centroids would first need to be corrected for location bias. This is a factor that we will directly test in the forthcoming posts.
Edit, 03/14/2024: Tanaka et al. (2002) also used centroid, rather than origin locations, as they state in their section 4.1.
Factor 2: Natural clustering of earthquakes in catalogs
Hartzell and Heaton (1989) clearly showed that natural clustering of earthquakes can create extremely strong apparent tidal correlations. This is a fundamental problem with earthquake catalogs: they have strong inter-event dependency. Studies that do not test the effect of this natural clustering, or choose to report results from a non-declustered catalog, should be viewed with some suspicion.
Tsuruoka et al. (1995) used a higher magnitude cutoff, removing more dependent events, but did not specifically test for the effect of remaining clusters. Tanaka et al. (2002) did test declustering, but ultimately reported correlations from the non-declustered catalog.
Métivier et al. (2009) stated that the impact of clustering on their analysis should be minor, because the periods they were examining were relatively short (12-24 hours). They did not test this statement using a declustered catalog. We note that the correlation they observed was strongest in small, shallow, continental earthquakes, which contain a high proportion of aftershocks. When Hartzell and Heaton declustered the Southern California dataset (removing 80% of events), their p-value for a 1-day period increased by 21 orders of magnitude. Thus, it appears likely that aftershocks could impact the analysis of Métivier et al. There is simply no way for us to know whether the identified small signal (0.2-0.3%) would persist in a declustered catalog.
Factor 3: Variations in preferred tidal phase
Because we don’t know how tidal stresses might actually trigger earthquakes, there is some freedom in interpreting the preferred phase for a given collection of earthquakes. Phases of 0° are easy - that’s just peak stress, which makes sense. Phases of -90° coincide with the maximum rate of stress increase. Phases between -90° and 90° are encouraging. Anything else is harder to simply interpret from a fault physics perspective - which means that results having those weird phases shouldn’t be used to support ‘typical’ ideas of earthquake triggering. In any case, discussion of preferred phase seems important but is missing from some studies.
Tsuruoka (1995) and Tanaka et al. (2002) both found that Δτ for shallow thrust events had a preferred phase of about -45°, in the rising stress domain. However, both studies saw a range of preferred phases, and neither study really made a consistent effort to differentiate between or interpret the preferred phases of their various identified correlations.
Factor 4: Ocean tides and submarine earthquakes
Finally, it is important to note when a study looks at earthquakes below the ocean but only studies the solid earth tide. This factor is restricted to the older studies, from a time when calculation of ocean loading was impractical (Heaton, 1975; Heaton, 1982). However, it is important to keep this in mind. We note that Métivier et al. (2009) only studied solid earth tide; to avoid this issue, they restricted their study to earthquakes on land, far from the coasts.
So, what’s next?
Our curiosity is piqued: do any of the “Yes” boxes still hold up to new data? We think it’s a fun idea to follow Heaton (1982)’s example and try to test the existing results, as much as possible.
We cannot directly replicate the studies above because we do not know exactly what data were included, and do not have access to the codes used at the time. Furthermore, none of these papers included any example calculations, so we cannot directly validate any results we do come up with.
However, the ideas behind the methods are described well enough to follow them using newer, open-source codes. We can expect that results with these codes will differ slightly, but we think we should be able to recreate the general trends observed in prior studies, if applied to the same data.
The GCMT catalog has swelled to over 60,000 events, so we can look at a lot of newer data.
So — can we replicate the results, at least to a reasonable level? What will hold up, and what won’t? Place your bets in the comments!

References:
Bradley, K., Hubbard, J., 2024. The great tidal earthquake hypothesis test, part I. Earthquake Insights, https://doi.org/10.62481/9ab803be
Cochran, E.S., Vidale, J.E. and Tanaka, S., 2004. Earth tides can trigger shallow thrust fault earthquakes. Science, 306(5699), pp.1164-1166. https://doi.org/10.1126/science.1103961
Hartzell, S., and Heaton, T., 1989. The fortnightly tide and the tidal triggering of earthquakes + Erratum. Bulletin of the Seismological Society of America, 79(4), pp. 1282-86. Available at: https://authors.library.caltech.edu/records/39ffh-nrm98
Heaton, T.H., 1975. Tidal triggering of earthquakes. Geophysical Journal International, 43(2), pp.307-326. https://doi.org/10.1111/j.1365-246X.1975.tb00637.x
Heaton, T.H., 1982. Tidal triggering of earthquakes. Bulletin of the Seismological Society of America, 72(6A), pp.2181-2200. https://doi.org/10.1785/BSSA07206A2181
Hough, S.E., 2018. Do large (magnitude≥ 8) global earthquakes occur on preferred days of the calendar year or lunar cycle?. Seismological Research Letters, 89(2A), pp.577-581. https://doi.org/10.1785/0220170154
Ide, S., Yabe, S. and Tanaka, Y., 2016. Earthquake potential revealed by tidal influence on earthquake size–frequency statistics. Nature Geoscience, 9(11), pp.834-837. https://doi.org/10.1038/ngeo2796
Métivier, L., de Viron, O., Conrad, C.P., Renault, S., Diament, M. and Patau, G., 2009. Evidence of earthquake triggering by the solid earth tides. Earth and Planetary Science Letters, 278(3-4), pp.370-375. https://doi.org/10.1016/j.epsl.2008.12.024
Tanaka, S., Ohtake, M. and Sato, H., 2002. Evidence for tidal triggering of earthquakes as revealed from statistical analysis of global data. Journal of Geophysical Research: Solid Earth, 107(B10), pp.ESE-1. https://doi.org/10.1029/2001JB001577
Tsuruoka, H., Ohtake, M. and Sato, H., 1995. Statistical test of the tidal triggering of earthquakes: contribution of the ocean tide loading effect. Geophysical Journal International, 122(1), pp.183-194. https://doi.org/10.1111/j.1365-246X.1995.tb03546.x





The topic of this discussion is very stimulating, thanks. I need to point out the difference between body tides, and fluid tides. Moreover, it should be distinguished the horizontal component of the body tide with respect to its vertical component. The effects of the tides should be differentiated as a function of the tectonic setting, i.e., more frequent thrust earthquakes during high tide, and more frequent normal fault related earthquakes during the low tide (see Riguzzi et al., 2010). We wrote a number of articles of the theme and I list them here for those who may be interest in the astronomical effects on geodynamics.
Scoppola B., Boccaletti D., Bevis M., Carminati E. & Doglioni C. (2006): The westward drift of the lithosphere: a rotational drag? Bull. Geol. Soc. Am., 118, 1/2; p. 199–209; doi: 10.1130/B25734.1.
Riguzzi F., Panza G., Varga P. & Doglioni C. (2010): Can Earth’s rotation and tidal despinning drive plate tectonics? Tectonophysics, 484, 60–73, doi:10.1016/j.tecto.2009.06.012.
Crespi, M., Cuffaro, M., Doglioni, C., Giannone, F., & Riguzzi, F. (2007): Space geodesy validation of the global lithospheric flow. Geophysical Journal International, 168, 491-506, doi: 10.1111/j.1365-246X.2006.03226.x.
Cuffaro M. & Doglioni C. (2007): Global Kinematics in the deep versus shallow hotspot reference frames. In: Foulger, G.R., and Jurdy, D.M., eds., Plates, plumes, and planetary processes, Geol. Soc. Am. Spec. Pap., 430, 359–374, doi: 10.1130/2007.2430(18).
Doglioni C., Ismail-Zadeh A., Panza G., Riguzzi F., 2011. Lithosphere-asthenosphere viscosity contrast and decoupling. Physics of the Earth and Planetary Interiors, 189, 1-8.
Sottili G.L., Palladino D., Cuffaro M., Doglioni C. (2015) Earth’s rotation variability triggers explosive eruptions in subduction zones. Earth Planets Space, 67:208 DOI 10.1186/s40623-015-0375-z
Doglioni C. and Panza G.F. (2015) Polarized plate tectonics. Advances in Geophysics, 56, 3, 1-167, http://dx.doi.org/10.1016/bs.agph.2014.12.001
Carcaterra A. and Doglioni C. 2018. The westward drift of the lithosphere: a tidal ratchet? Geoscience Frontiers, 9, 403-414 https://doi.org/10.1016/j.gsf.2017.11.009
Cuffaro M. and Doglioni C. 2018. On the increasing size of the orogens moving from the Alps to the Himalayas in the frame of the net rotation of the lithosphere. Gondwana Research, 62, 2–13 doi.org/10.1016/j.gr.2017.09.008
Zaccagnino, D., Vespe, F. and Doglioni, C. 2020. Tidal modulation of plate motions. Earth Science Reviews, 205, 103179, https://doi.org/10.1016/j.earscirev.2020.103179
Ficini, E., Cuffaro, M. and Doglioni C. 2020. Asymmetric Dynamics at Subduction Zones Derived from Plate Kinematic Constraints. Gondwana Research, 78, 110-125, https://doi:10.1016/j.gr.2019.07.013
Zaccagnino D., Doglioni C., 2022. Earth’s gradients as the engine of plate tectonics and earthquakes. La Rivista del Nuovo Cimento, https://doi.org/10.1007/s40766-022-00038-x
Zaccagnino D., Telesca L., Doglioni C., 2022. Correlation of seismic activity and tidal stress perturbations highlights growing instability within the brittle crust. Scientific Reports, 12:7109 | https://doi.org/10.1038/s41598-022-11328-z
Kossobokov, V.G. and Panza, G.F., 2020. A myth of preferred days of strong earthquakes?. Seismological Research Letters, 91(2A), pp.948-955.
Very nice summary, if disconcertingly inconclusive! Why not next see if regional tidal triggering studies are as discordant, and compare them with these global surveys?