Do Earth tides warn of impending large earthquakes?
We deep-dive a new study on possible precursors of dangerous earthquakes
Citation: Bradley, K., Hubbard, J., 2023. Do Earth tides warn of impending large earthquakes? Earthquake Insights, https://doi.org/10.62481/695e5945
If this post has reverted to behind a paywall, download a pdf here. All of our analyses of recent research papers are intended to be permanently free to read and comment to allow open discussion by the scientific community.
In brief: We take a close look at a new GRL paper claiming evidence for several years of warning signals before the M6.4 and M7.1 2019 Ridgecrest earthquakes. We find that the signal interpreted in this study has little relationship with the faults that hosted the Ridgecrest earthquakes; the suggestion that all faults and large earthquakes have this newly discovered preparatory phase is also entirely unsupported. The signal more arises from previously documented faults in the region which are known to exhibit the studied behavior. An examination of the earthquake sequences that make up more than half of the data, and also the earthquakes that fall outside of the selection box, should rapidly reveal that the assumptions and conclusions of the paper are incorrect. The time windowing approach adopted in the paper, intended to suppress artifacts arising from the data distribution, instead convolves signals over long time scales, making it very hard to understand changes over time.
A new Geophysical Research Letters paper on earthquake precursors has been brought to our attention via a short piece published in Eos by seismologist Victor Tsai, associate editor at GRL. The implications of the paper appear to be very interesting. As per Prof. Tsai:
Any new result about earthquake forecasting is exciting, of course, because this is the biggest unsolved, and possibly even unsolvable, problem in earthquake studies.
The paper title and authors are:
The strongest claims of the paper are as follows:
This paper joins a ever-growing collection of studies that attempt to discover, ex-post-facto, signals of change prior to large earthquakes. Changes in fault behavior before an earthquake are generically called precursors, and are of great interest from both the earthquake physics and hazard mitigation perspectives. Over the last decades, advances in data collection and analysis, and deployment of new instrument networks, have increased the number of observations of active faults, in some cases by orders of magnitude. At the same time, laboratory experiments and numerical models suggest that earthquakes should commonly begin with a potentially detectable nucleation phase, possibly extending over the hours to years leading up to large earthquake ruptures.
However, reports of discovery of precursory signals tend to fall flat upon further analysis. There is currently no reliable observational evidence for large-scale nucleation before big earthquakes. We previously did a deep-dive on a recent Science paper that claimed to find precursory slip before large earthquakes using high-rate GPS data from around the globe. We ultimately decided that remaining coherent noise in their data swamps any potential (and still unproven) signal of precursory slip, even in the final few hours before large earthquakes.
This new GRL paper claims to see an effect lasting several years, on a fault that slips so slowly that it wasn’t even identified before its 2019 rupture.
The Ridgecrest earthquake sequence started on July 4, 2019 with foreshocks: first a series of escalating small events, followed two hours later by a Mw4, and then a Mw6.4 earthquake. This largest foreshock ruptured the NE-SW oriented Salt Wells Valley Fault passing near the city of Ridgecrest. Aftershocks of the Mw6.4 illuminated not just this fault, but also a section another orthogonal fault system. Thirty-four hours after the Mw6.4, that fault also ruptured, extending further in both directions. This was the mainshock: a Mw7.1.
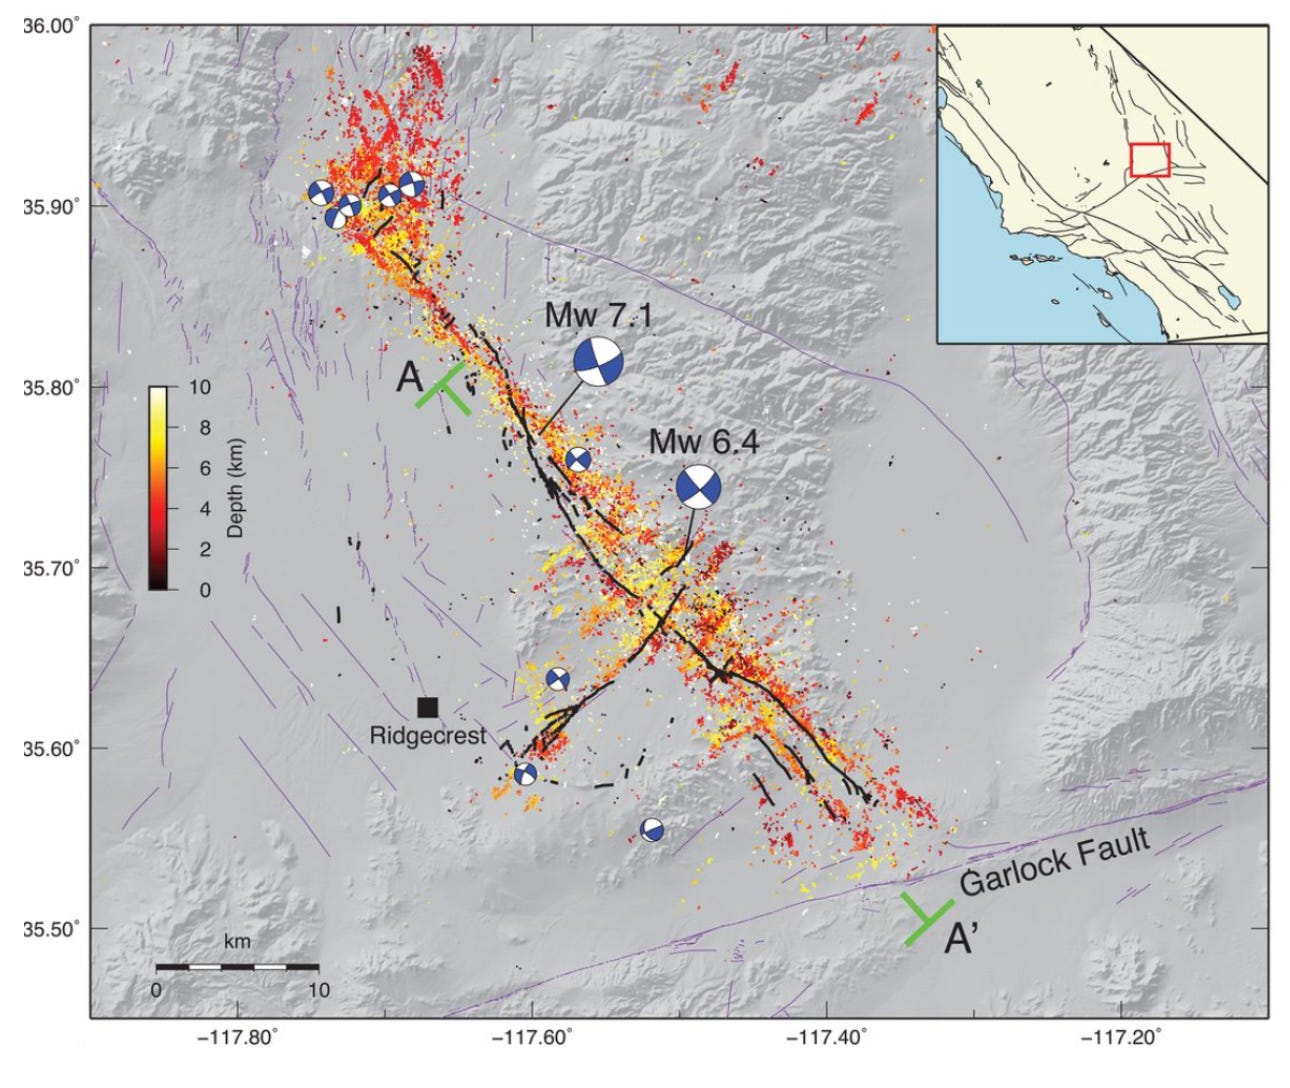
This was one of the biggest earthquakes in modern history in the continental United States. Earthquake scientists flocked to the area, mapping the surface ruptures in detail. The dense seismic network in the region allowed seismologists to develop ultra-detailed catalogs of the aftershocks and map the precise geometries of the faults that ruptured in three dimensions. Dozens of research articles have been published, documenting the details of the earthquake.
However, the recent paper published in GRL is the first we have seen to date that claims to identify precursory behavior associated with the tides. As usual, great claims require strong evidence. So, are the claims of this paper supported by the data and analytical method? Let’s take a close look.
This post has to deal with a lot of different topics, so we have organised it into several sections:
1. What is tidal forcing of earthquakes?
The study of the tides is the tomb of human curiosity. - Francois Arago (1786-1853)
First, let’s talk a little about tides.
The Earth and Moon both orbit the center of mass of the Earth-Moon system, just as the Earth and Sun orbit the center of mass of the Earth-Sun system. Because the Earth is much more massive than the Moon, the center point is actually located inside the Earth, and we can say that the Moon orbits the Earth without sounding too silly. The same applies for the Earth orbiting the Sun.
One of Isaac Newton’s more famous laws (aside from he who smelt it dealt it) states that the force of gravity exerted by the mass of an object on another object rapidly decreases with the distance between them - to be exact, it decreases as the square of the distance. The attractive force of the Moon is strongest at the point on Earth’s surface that is closest to the Moon, weakest at the point farthest from the Moon, and continuously changes in between. This force gradient causes the Earth (which is stuck in its orbit and can’t just fall into the Moon like gravity wants it so very badly to do) to deform, bulging outward in both directions along an imaginary line between the Earth and the Moon. This is called the tidal bulge, and because the Earth spins (at a rate of exactly one day per day, what are the chances of that!?!) much faster than the Moon orbits the Earth (about once a month), we see the tidal bulge pass a point on Earth about twice per 24 hours - more or less.
If you are living anywhere between 28.5° South latitude and 28.5° North latitude, you have actually experienced the Moon at zenith (the Moon is straight overhead) and anti-zenith (the Moon is straight down through the center of the Earth), and have stood right at the top of the great Mount Tidal Bulge without realising it.
Gravitational distortion of Earth is caused by all masses in our solar system, galaxy, and universe - but only the Moon and the Sun are close enough, massive enough, and stuck in orbit enough to cause significant, periodic Earth tides. While we are most familiar with ocean tides because the sea is capable of sloshing all over the place as Mt. Tidal Bulge passes beneath it, the surface of the solid Earth actually moves up and down as the bulge passes - by up to half a meter!
Here’s a good video that explains tides pretty well.
Tidally induced earthquakes
The deformation of Earth caused by solid tides creates small but predictable changes in stress inside the crust and mantle. Because faulting is stress-controlled, these small stress changes can actually induce earthquakes on faults that are already close to failure. This is called tidally induced seismicity, and it is a rapidly growing field of seismology. The stress changes in the shallow crust due to Earth tides are very small - around 1 kiloPascals (kPa). Luckily, there is a standard reference for 1 kPa which is the stress exerted on a table by a stack of the complete Harry Potter book series (1 kPa = 1 cHPbs).
These stress changes are quite small. Despite this apparent difficulty, some kinds of earthquakes are very well known to be tidally controlled. These are earthquakes where the host faults are already close to failure stress - either because they are very late in their seismic cycle of loading and sudden release, or because some physical property like fluids along the faults allow them to fail under small added stress.
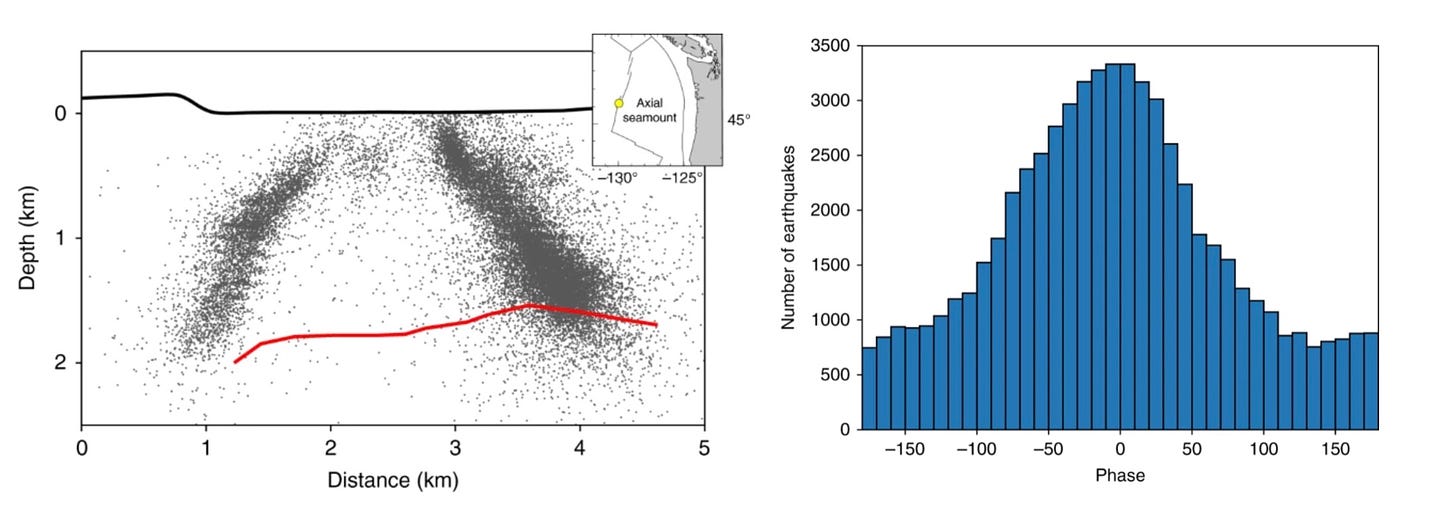
A spectacular example of tidal triggering occurs at a mid-ocean ridge volcano offshore of Washington State (Scholz et al., 2019). The authors of the paper showed that tidal depressurization of the magma chamber at Axial Volcano drove tide-correlated earthquakes. The peak in the histogram below shows that the vast majority of earthquakes happened near low tide. There are plenty of other studies that show tidal forcing - but mostly in places where it makes sense that small stress changes can induce seismicity.
2. What does the study say?
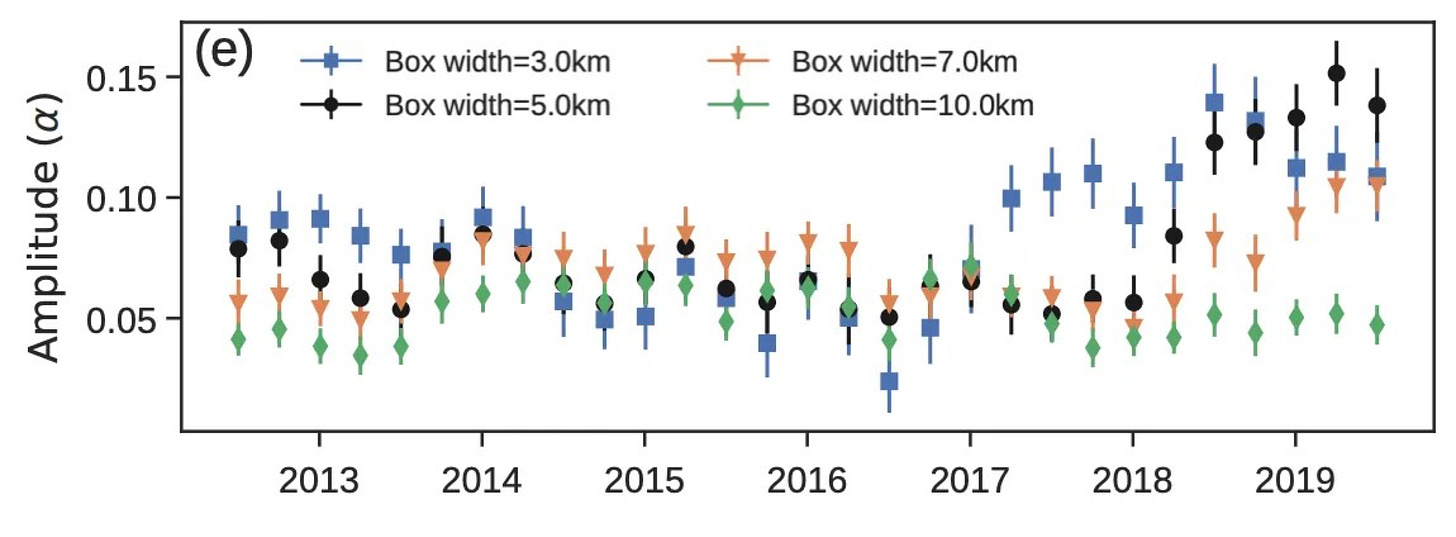
In this paper, the authors claim to document a link between the rate of tidal stressing - i.e., how much the tides impact the seismicity rate - and the later occurrence of the 2019 Mw7.1 Ridgecrest earthquake. The possible causal link between these processes is unclear, but the authors present the figure below: starting in 2018, around the Paxton Valley Fault, there was apparently a large increase in the tidal modulation following six years of lower values. During this “strong tidal modulation” period, more seismicity tended to occur when the stresses induced by the tides lined up with overall preexisting stress state. You can see this on the plot: the phase shift is close to zero (that means it’s lined up) and the amplitude is high (meaning the effect was stronger than previously).
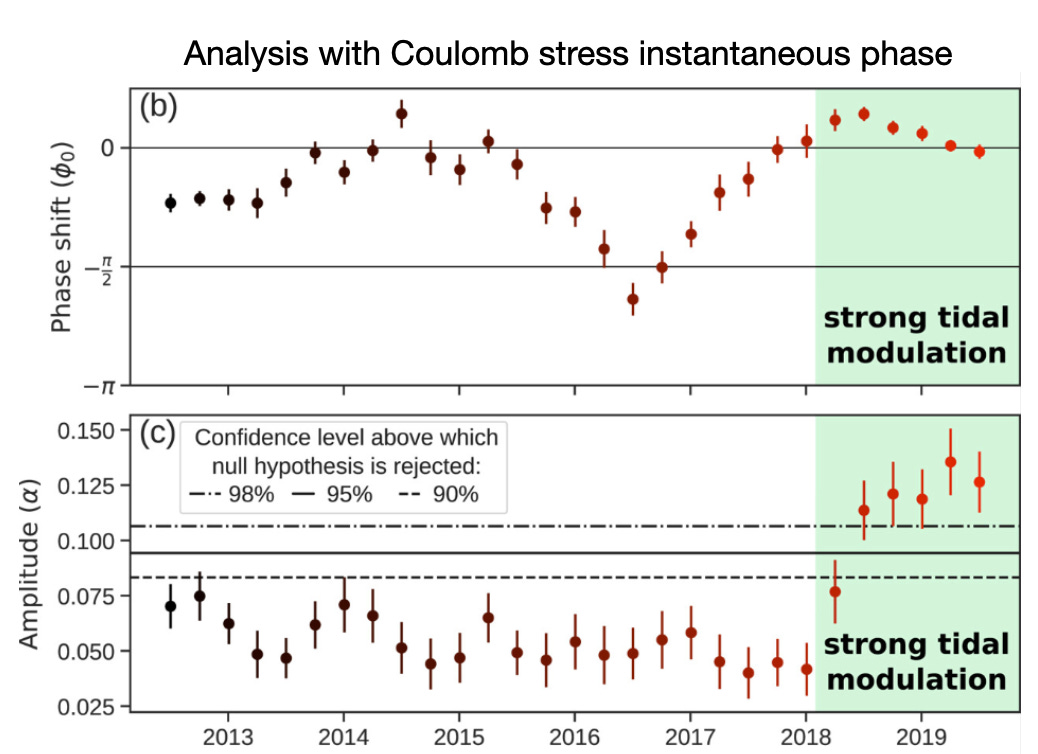
Understanding the data points on the time series above isn’t easy, but there are really only a couple key things that you need to know.
First, each data point may be plotted at a specific time, but it actually represents an average over the previous 3.4 years. Because the data points are plotted every 3 months, but contain 3.4 years of data, 85% of the data going into each data point is the same as the point before it and the one after it.
Second, the datapoints that are plotted are derived from a catalog of 27,406 earthquakes in a rectangular box centered around the 2019 Ridgecrest earthquake, averaged together.
Note: we’re skipping over some of the details of the paper here, in order to focus on what we think are the most critical arguments.
With that in mind, let’s take a look at the geology of the region.
3. What is the earthquake geology of the Ridgecrest area?
It was certainly surprising (to us) to hear that the Ridgecrest earthquake was being studied for seismic precursors; the Paxton Valley Fault had not even been identified prior to 2019. Seismically noisy faults in California can usually be mapped because the regional seismic network is powerful enough to resolve aligned seismicity along fault planes. This was not the case at Ridgecrest: we can’t see the fault even if we look at the hypocenter data in retrospect, with the benefit of knowing where the fault should be.
However, when the Ridgecrest earthquake did finally occur, not many geologists were actually that surprised - because the surrounding area is very seismically active.
Let’s take a look at the record of earthquakes before the 2019 foreshock, and then after the mainshock. A recently published focal mechanism catalog can tell us a lot about the seismicity of the study area, by giving us a sense of the location and style of active faulting.
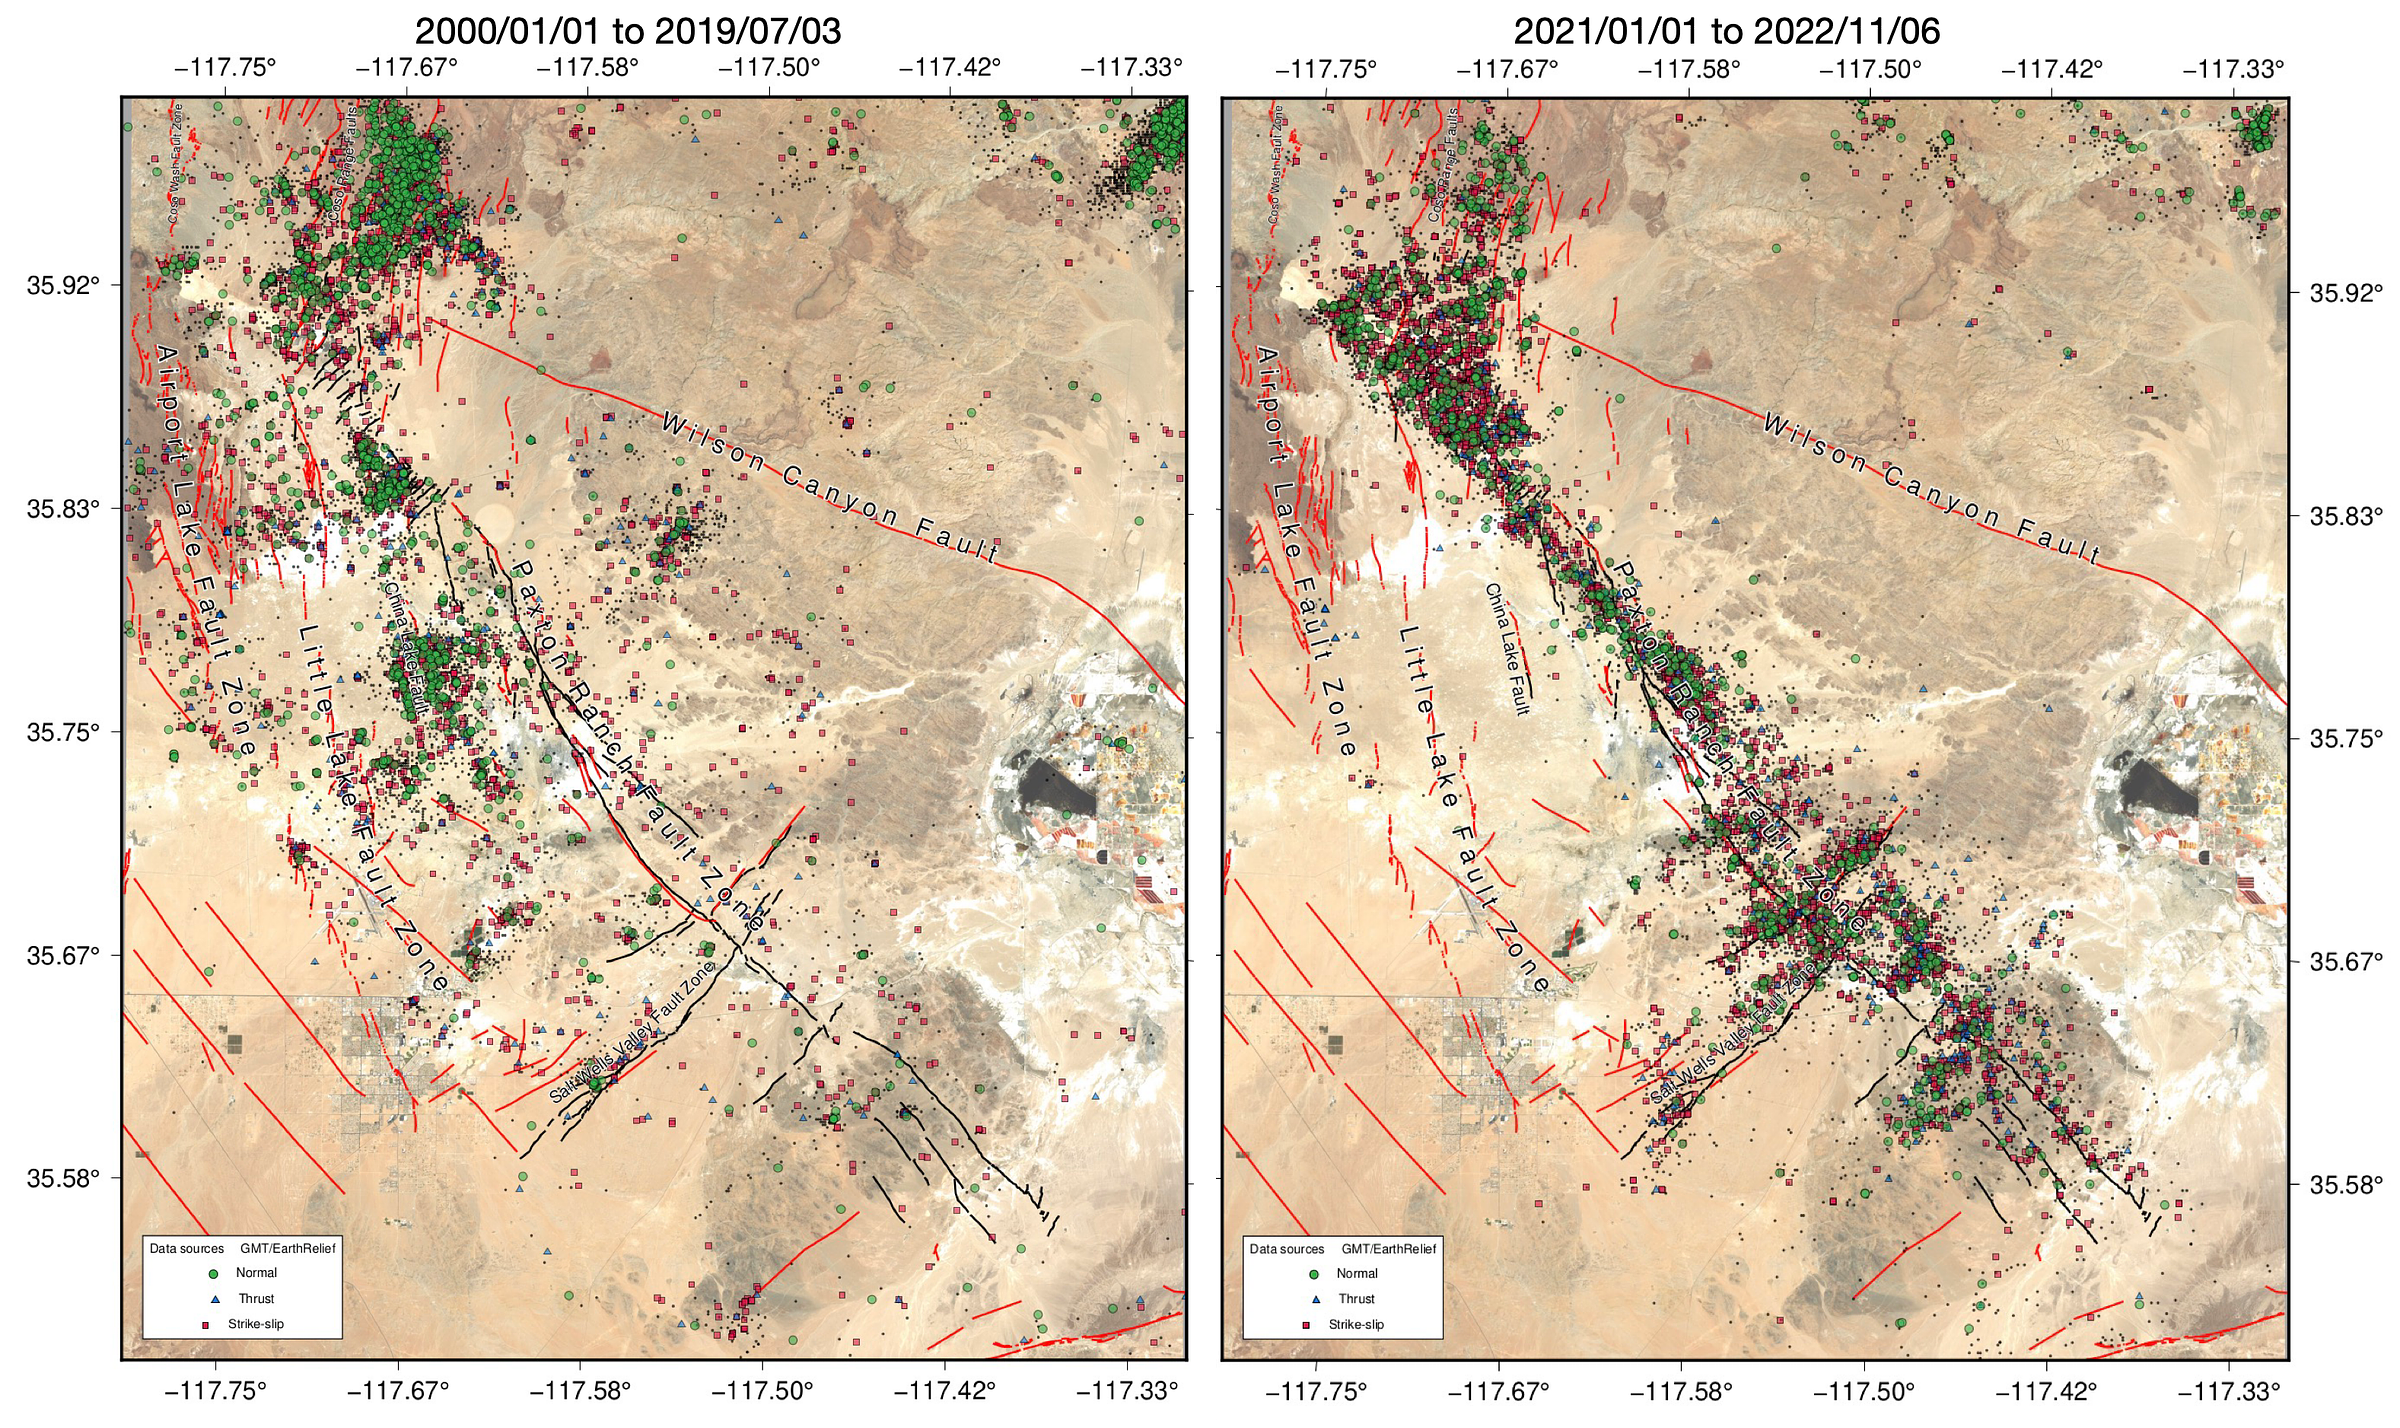
The left-hand panel shows about 20 years of data before the Ridgecrest earthquake. Events are widely distributed, with some concentrations along the China Lake Fault, Little Lake and Airport Lake Fault Zones, and in the unnamed zone of distributed faulting in the southern Coso Mountains. While most of these events are not included in the GRL analysis, they indicate that widespread seismicity on both sides of the Paxton Valley Fault.
The right-hand panel shows earthquakes after the first wave of aftershocks have died down somewhat. The events delineate a fault zone that is largely absent from the 2001-2019 data, indicating that most of the regional seismicity in the pre-Ridgecrest period did not reflect slip on the Paxton Valley Fault. Even the strike-slip mechanisms located near the fault trace cannot be confidently attributed to slip on the main fault, as they do not show alignment or concentration that is visually different from the surrounding events.
The existence of many cross-faults that cut across the trace of the Paxton Valley Fault also complicates the interpretation of the pre-foreshock seismicity. These cross-faults are actually apparent in a few locations before the 2019 earthquake, suggesting that the NE-SW oriented faults were closer to failure than the NW-SE oriented main fault. This is, of course, consistent with the fact that the 2019 earthquake began with a foreshock on a NE-SW oriented fault.
What about the earthquakes along the actual rupture?
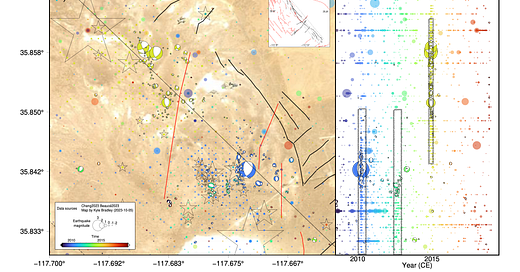
If we look within a 5 km-wide profile (this is the data selection box for the study at hand), there is an area with many earthquakes, located at the NW end of the 2019 rupture trace. Zoooooming in, and restricting our time period to the 2009-2019 (pre-foreshock) time window used in the study, we can see that earthquake clusters happened in 2010, 2013, and 2015. These clusters contribute a large proportion of the signal analyzed in the study.
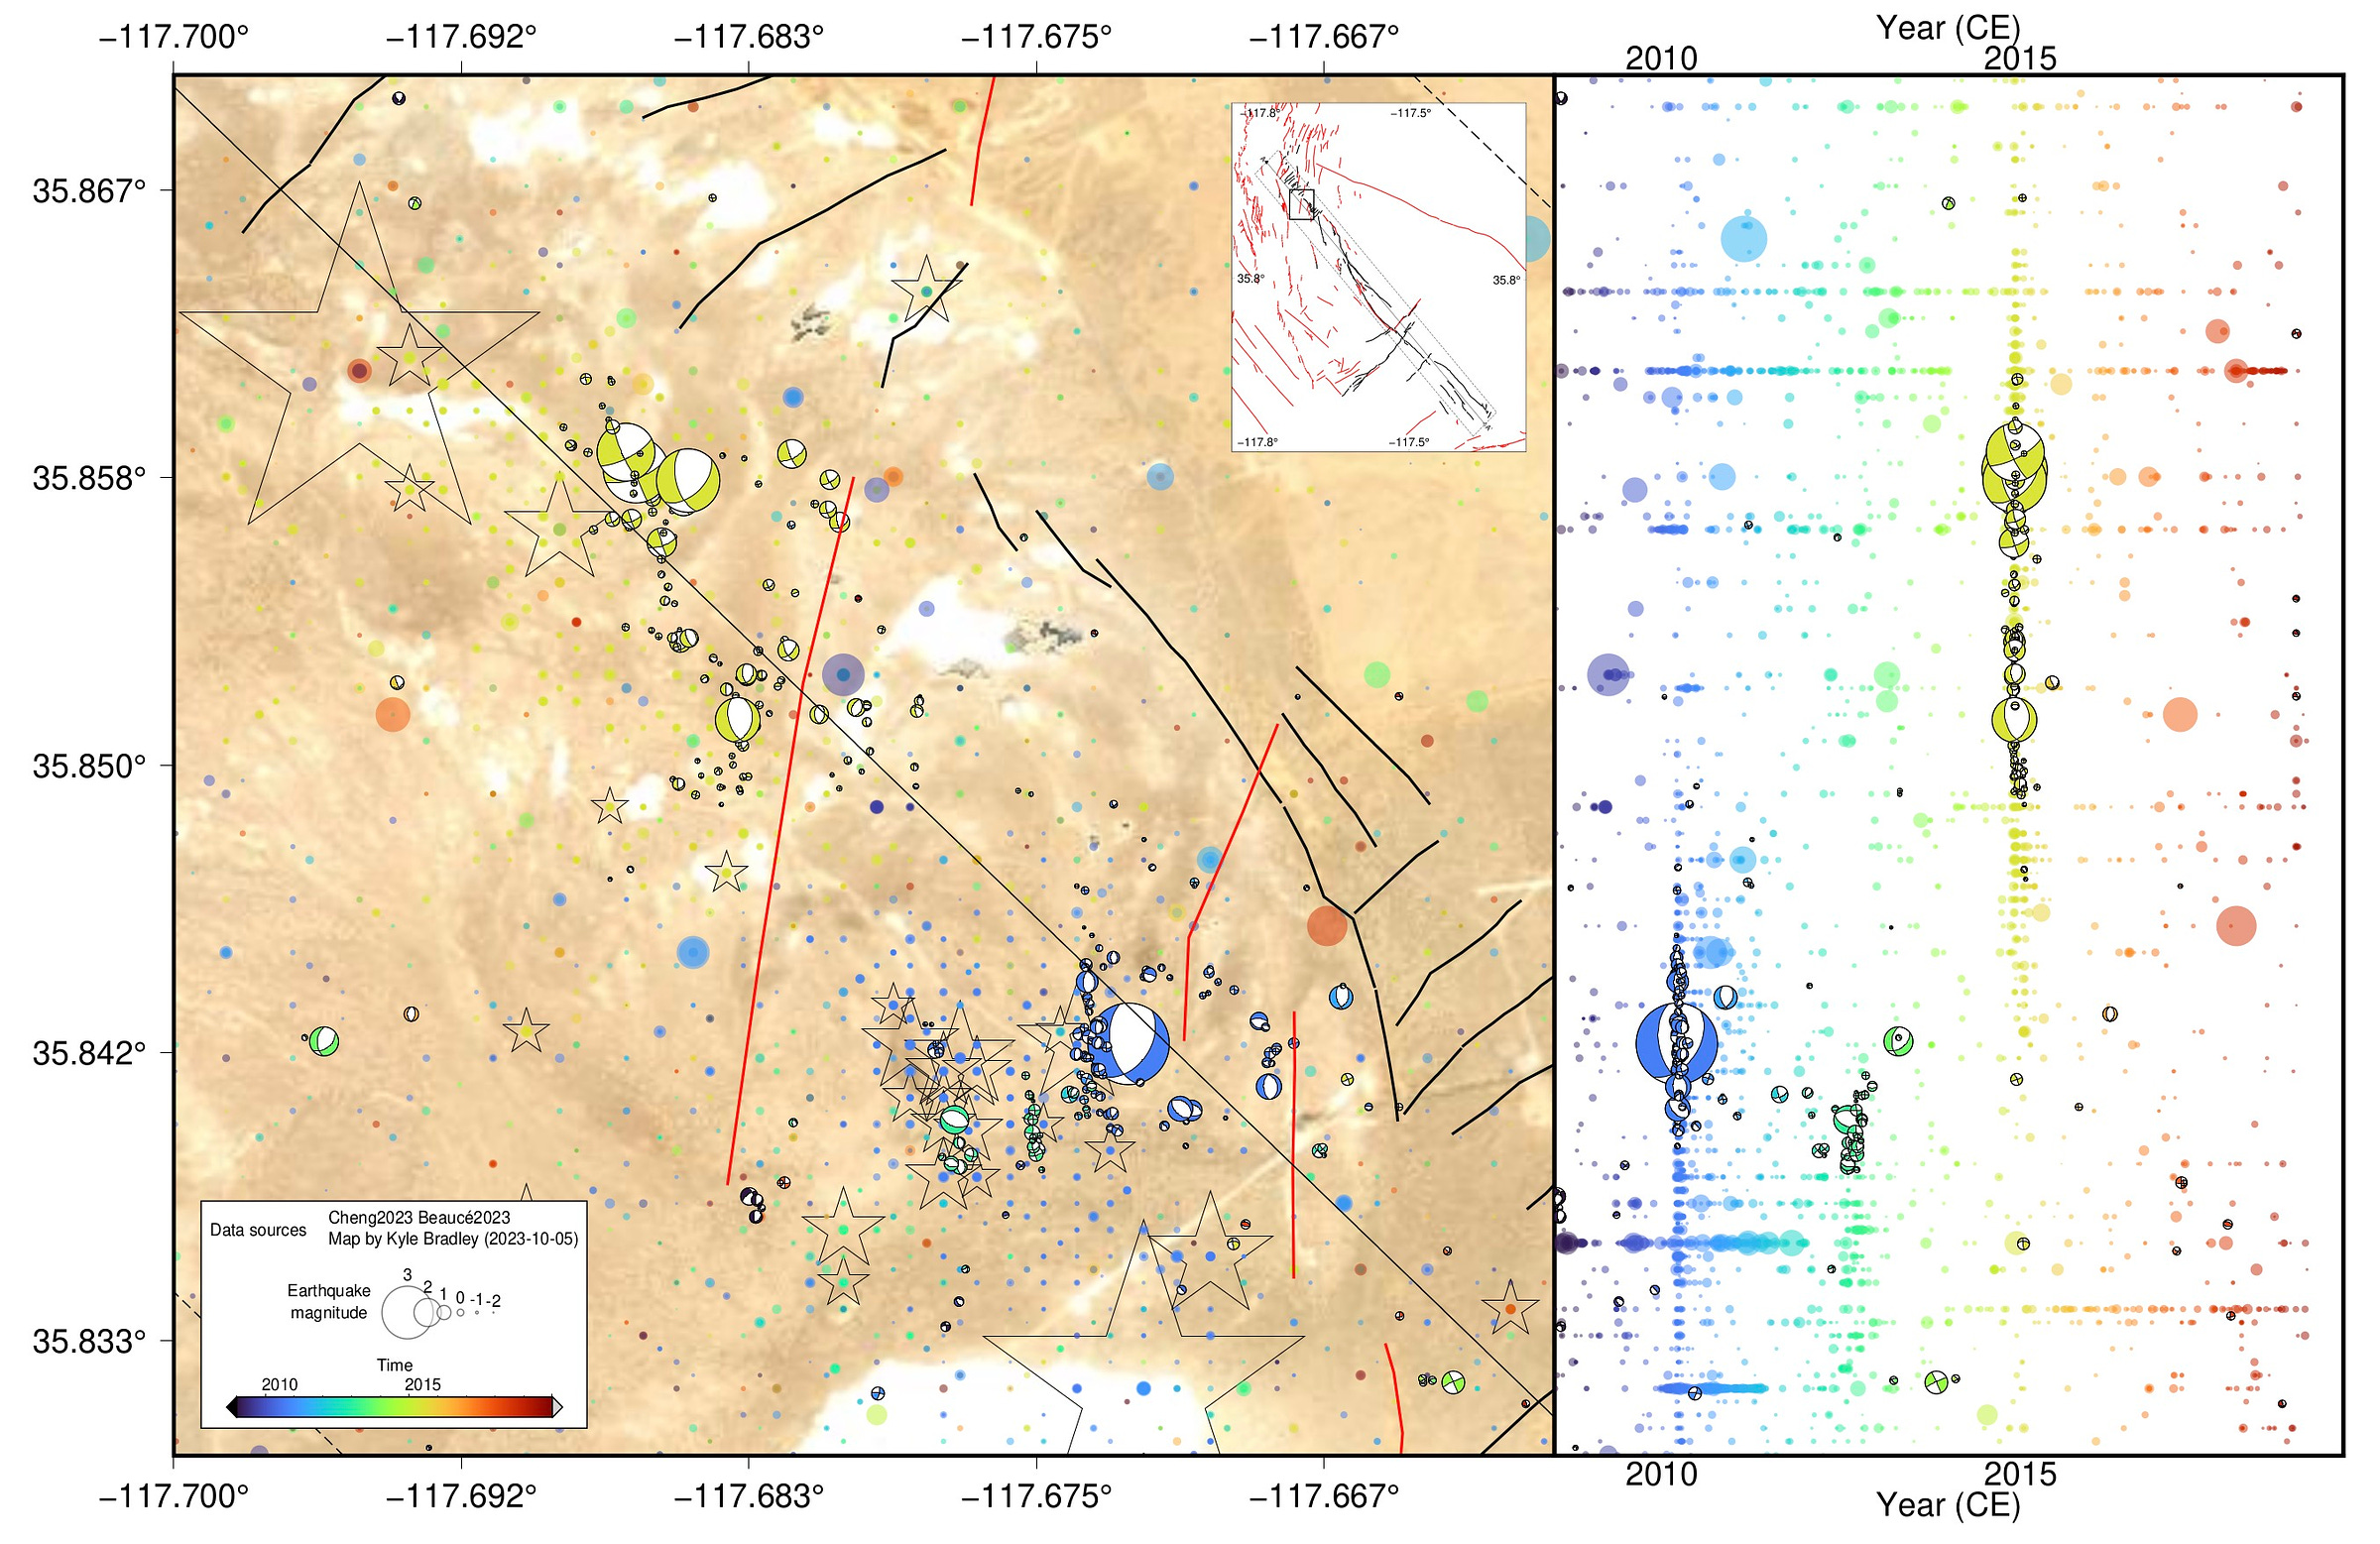

If the in-box seismicity really did reflect slip episodes on a “primed and ready to fire” Paxton Valley Fault, we would expect to see the events have a strong association with that large strike-slip fault surface. Instead, we see that the 2010, 2013, and 2015 earthquake sequences all began with a normal faulting event.
The 2010 sequence (blue) appears to be a typical mainshock-aftershock sequence on a north-south oriented normal fault present in the Quaternary Fault-and-Fold Database. Aftershocks are concentrated around the mainshock location.
Similarly, the 2013 sequence (green) began with normal fault rupture, but was followed by activation of a N-S striking strike-slip fault.
The 2015 sequence is very interesting: it started as a growing sequence of normal faulting events that culminated in two larger normal faulting events and two larger strike-slip events. This pattern of growing magnitudes and lateral migration is more consistent with a seismic swarm than a typical foreshock-aftershock sequence. Seismic swarms have many causes, but geothermal activity is implicated in many swarms.
The spatial pattern of hypocenters and focal mechanisms are consistent with the inferred fault planes (from the focal mechanisms), suggesting that the resolving power of the seismic network is strong, and that we can actually see details of these rupture sequences. This also means that we can confidently exclude the possibility that these events happened on the actual Paxton Valley Fault - they are too far away (compared to their scatter), and have the wrong geometry and rupture types.
What does the regional picture tell us?
Our maps suggest to us that the Paxton Valley Fault itself was not noticeably seismic during the 2009-2019 time period. Areas around the fault, in contrast, were highly seismic. The seismicity is particularly strong around the Coso Volcanic Field, and seismicity aligns along N-S oriented structures that extend southward from that very active area.
This lack of seismicity along the actual ruptured fault is clear in the catalog that is used in the paper. We drew two 5 km-wide profiles parallel to the profile used in the study, one located to the NE and one to the SW, and simply counted the number of catalog earthquakes within each box. There is almost no difference between event counts, because most of the events are concentrated over a broad area near the Coso Volcanic Field.
In summary, it seems unlikely that the events that form the basis of this study are not actually associated with failure of the Paxton Valley Fault, and therefore their tidal periodicity can’t be interpreted as reflecting the state of that fault.
4. A deeper look at the analysis
The first thing we noticed is that while the authors provide the original data - the seismicity catalog - they did not publish their code or explicit calculations, instead referring the reader to a variety of other papers for their methods. They also do not provide any processed data output from these codes, i.e. the tidal forcing, the fits, etc. Because of this we were not able to replicate their workflow, and had to rely instead only on the provided figures and text. This is in contrast to our recent analysis of Bletery and Nocquet (2023), where the authors published well-organized open-access data and code allowing study replication.
We do not have any reason to believe that the authors’ approach to calculating tidal stressing is flawed. However, the way that the data feeds into the resulting time series seems to us to be problematic, because of the sensitivity of the result to specific clusters of events. Here’s why:
The time series is short.
Recurrence intervals on faults are typically hundreds to thousands of years long, and we expect to see a variety of things happening during those interseismic periods, not associated with the eventual earthquake.
Here the authors look at ten years of seismicity data prior to the Ridgecrest earthquake - a brief window. Knowing what the range of behaviors is over the full interseismic period is not possible as modern seismic networks were not available for most of it. However, it is difficult to assess “anomalous” behavior on a system with such a short record. From a logical perspective, changes seen in a short time series may either reflect a process happening near the end of the series, or a suppressive process happening before - the baseline of behavior is not established.
The time series calculated by the authors is actually even shorter, because…The authors average their data using a 3.4 year time window, which obscures the data. The choice of window length strongly influences the resulting time series.
Since an earthquake or earthquake cluster continues to be included in the averaging window for the next 3.4 years, it is very difficult to tease apart the influence of specific events on the resulting time series.
The supplement does include some figures illustrating the impact of window length; those results show that the time series looks quite different as the window length changes from 2.59 years to 4.17 years. In fact, the shorter window shows a brief increase in apparent tidal forcing that then decreases for the last two data points to values statistically indistinguishable from the two initial data points.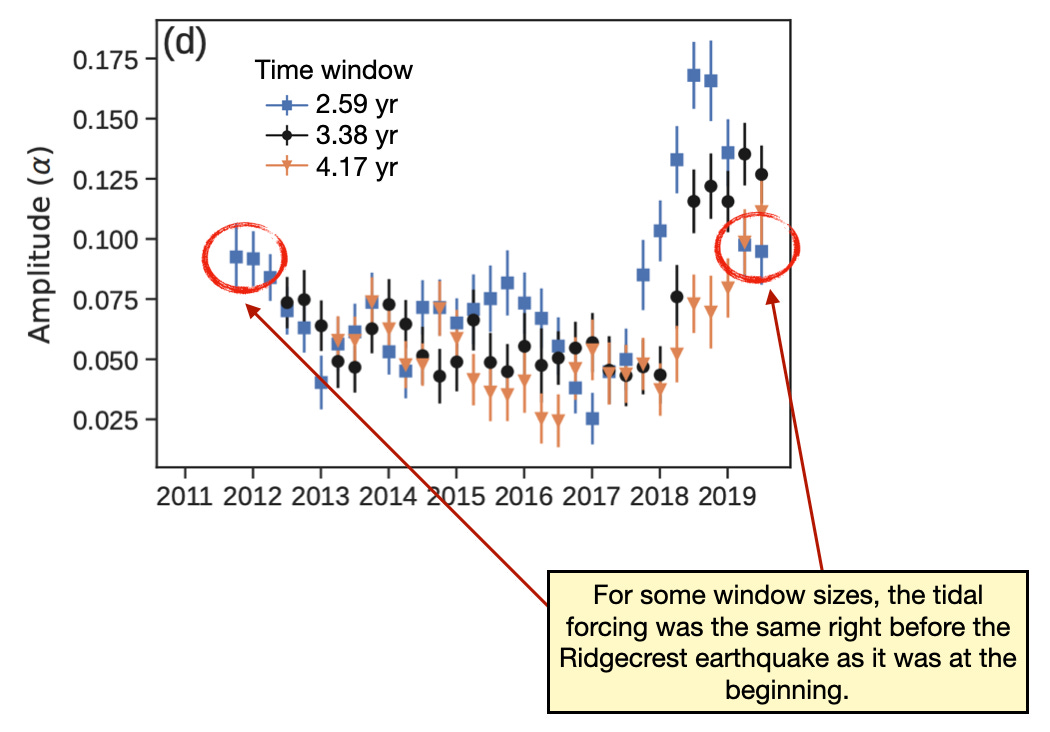
Figure 9: Figure S9d of Beaucé et al. (2023), illustrating that the results are not stable with respect to window size.
There is no objective reason why a window of any given length should be preferred - or even why any window should be applied at all. The authors write that because they use a long time window:
…our tidal analysis method […] addresses the problem of temporal clustering without removing subjectively defined aftershocks.However, as we show in the next point, this is not the case.
Individual clusters of events have a very large influence on the time series, an effect that is exacerbated by the time windowing.
Earthquakes tend to come in clusters: mainshocks with aftershocks. In calculations where events are weighted by magnitude, aftershocks are typically not a strong signal, because they tend to be smaller, often much smaller than mainshocks. In this study, however, events are equally weighted no matter their magnitude. This means that mainshock-aftershock clusters can have a disproportionate effect. In fact, other studies looking for tidal forcing have declustered their catalogs (i.e. removed aftershocks) to avoid having clustering impact their results.
Why does clustering matter? When a bunch of earthquakes occur close together in time (within seconds, minutes, or a few hours), they will all occur at nearly the time tidal forcing. Thus, these clusters of events can appear to be tidally forced, even though their proximity in time is simply the natural outcome of the earthquake trigger.If you were to plot a direct time series of tidal forcing over time, these event-clusters might look like spikes. In the time series of Beaucé et al., however, event-clusters are hard to see. Why? The 3.4-year time window means that each data point in the time series reflects an average of signals from the 3.4 years prior. So, when a new event occurs at a given time, its direct influence is obscured - but it continues to impact the time series for years to come.
How important is this? In their supplement, the authors test this effect by removing two periods with strong seismicity pulses, in 2010 and 2015 (clusters of events described in detail in the previous section). The figures in the supplement demonstrate that these event-clusters have a huge impact on the final time series, and are directly responsible for critical features. When we overlaid the time series with and without these pulses, we found that the single pulse in 2015 decreased the amplitude of the calculated tidal forcing by up to half of the total variation observed across the entire time series. In the final time series published in the paper, this pulse depresses the apparent tidal forcing for a period of 3.4 years: from when it started in 2015, to mid-2018. The apparent “step up” in tidal forcing in 2018 is a direct consequence of the event-cluster in 2015.
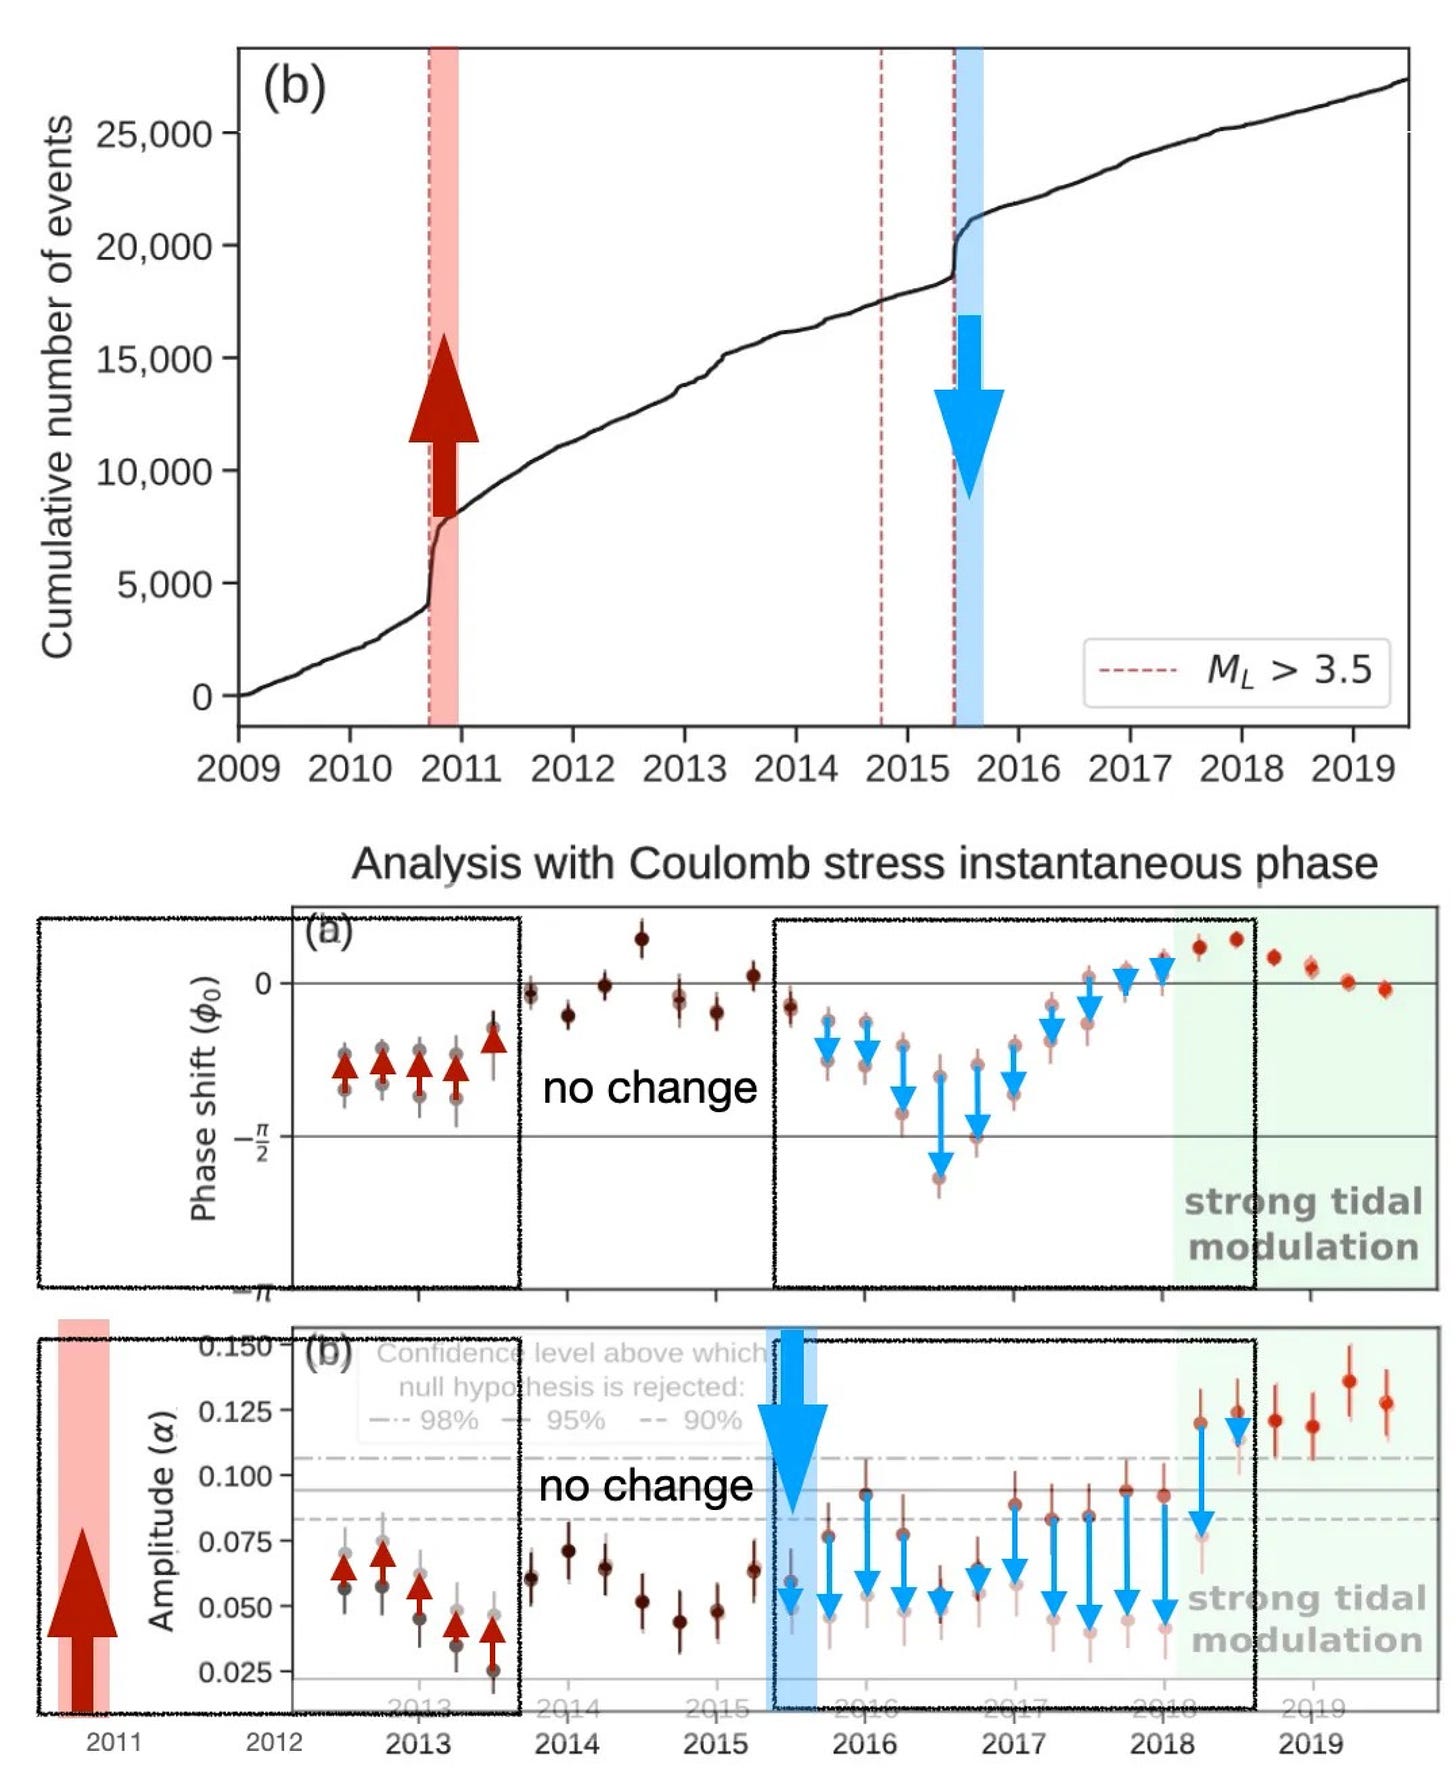
Figure 10: Top: Figure 1b of Beaucé et al. (2023). Bottom: Overlay of Figures S8ab (analysis without high-seismicity episodes in 2010 and 2015) on top of Figures 3bc (same analysis with those episodes). Red and blue arrows show the effect of the 2010 and 2015 high-seismicity episodes on the resulting time series: red = increase in amplitude of tidal forcing, blue = decrease in amplitude of tidal forcing. Boxes show the 3.4-year windows.
The authors claim that the time series without the 2015 event is even more compelling, showing a gradual increase from 2016 to 2019 rather than a step in 2018. However, we find it extremely concerning that brief bursts of seismicity can have such a strong influence on the time series. After all, there were many other smaller bursts of seismicity over this time period, which are also averaged into the time series; their effect remains unknown.
The outsize influence of brief event-clusters is especially concerning because…The spatial choice of data - within a narrow box around the eventual rupture - exerts a strong control on the resulting time series.
The authors select only data in a 5-km-wide box around the eventual rupture. How important is the choice of the box? We can’t test this directly due to the lack of code provided, but the authors provide a few time series in the supplement illustrating the impact.
When the authors widen the box to 10 km rather than 5 km, the effect disappears. When the authors make the box longer or shorter, the time series also changes significantly. If the seismicity in the region were primarily associated with the Paxton Valley Fault, then varying the box size would have little impact on the time series. Clearly that is not the case.
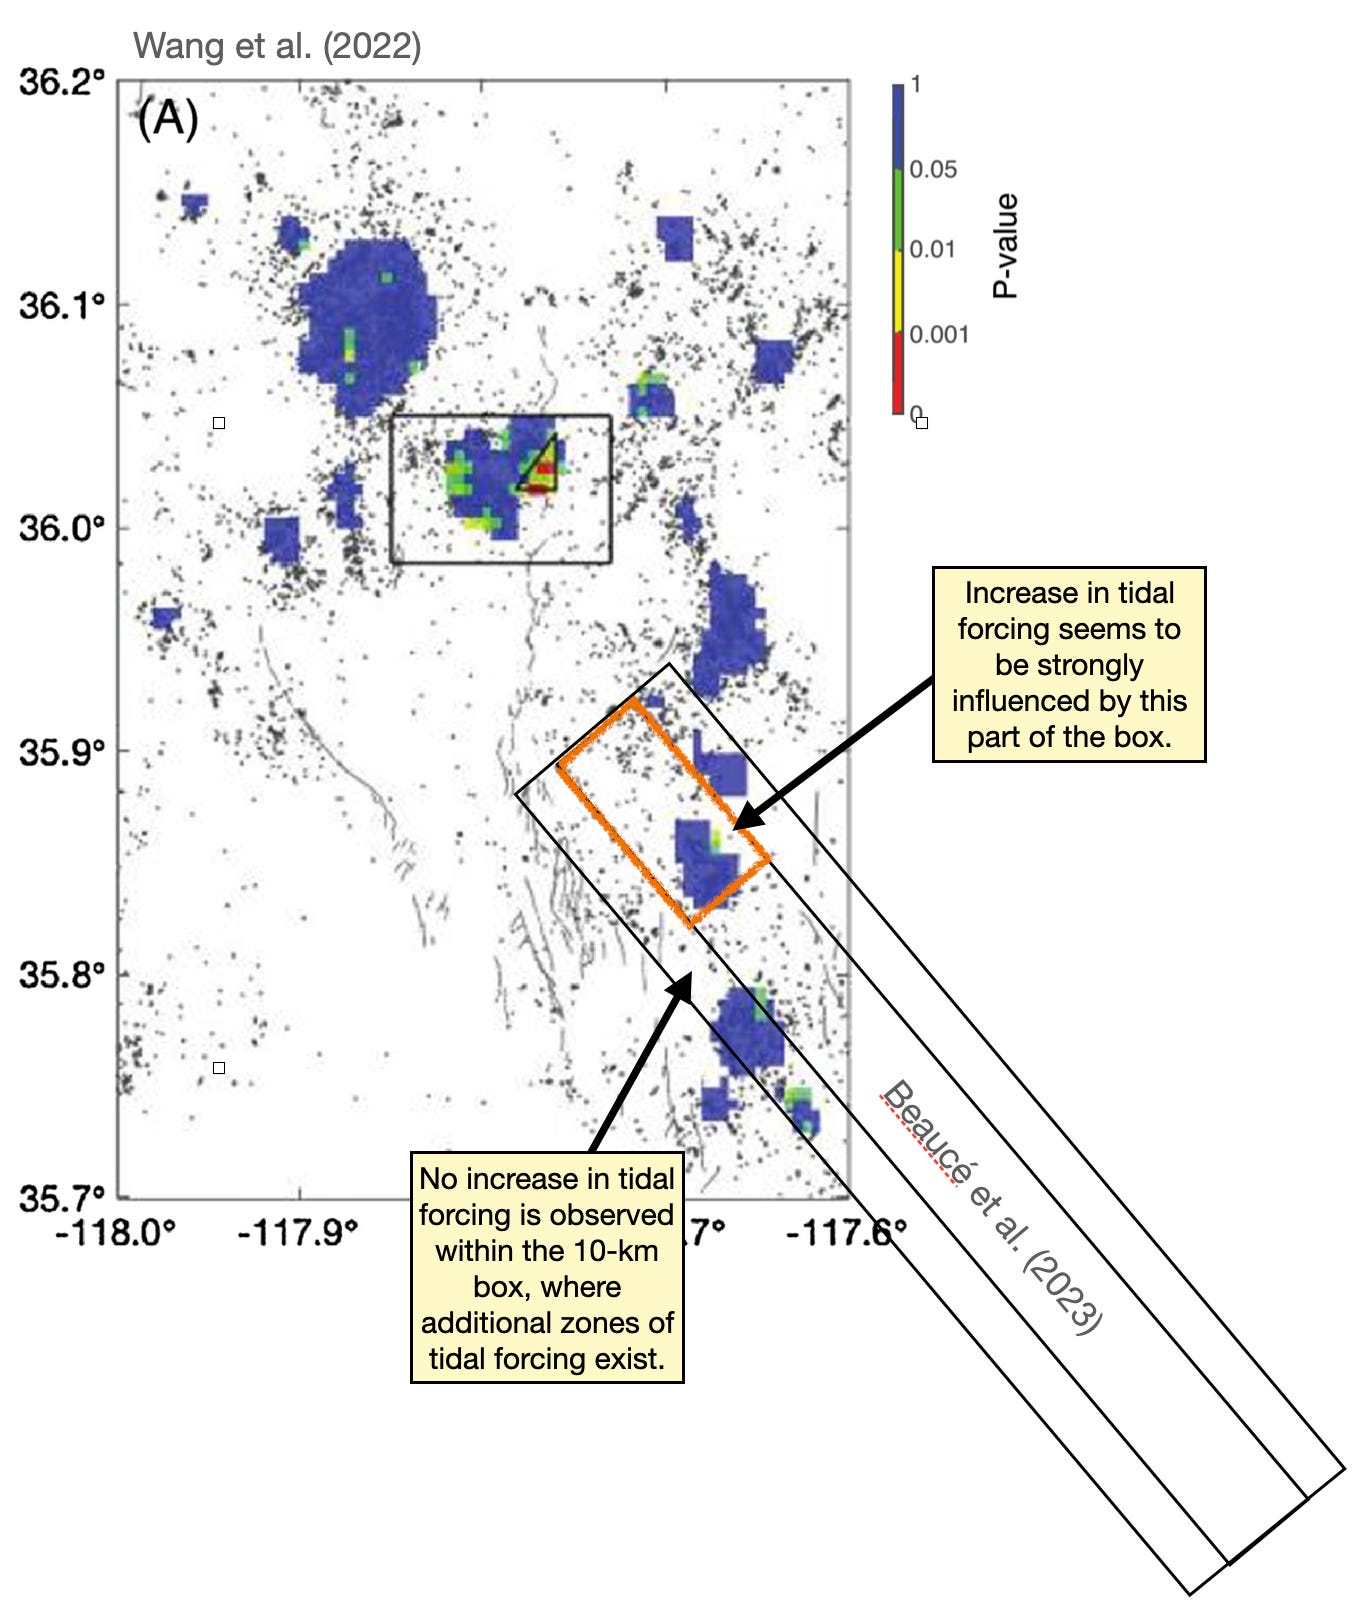
Most of the apparent signal in the final time series seems to be coming from a box 5 km x 10 km around the northwestern tip of the rupture - a box that includes the event-clusters in 2010 and 2015. We calculate that >14,600 of the earthquakes in the analysis occur in this box, or ~53% of the dataset.
Notably, seismicity in the north - where we infer that the signal is largely coming from - is not spatially associated with the initiation of the Ridgecrest earthquake. The earthquake initiated well to the south. It was also preceded by a M6.4 foreshock on a perpendicular fault.
So: what is going on geologically at the northwestern tip? The northwestern part of the Ridgecrest rupture approaches the Coso volcanic field - a region with distributed faulting, a high geothermal gradient, and thermally driven fluid circulation. All of these features are potentially relevant to the seismicity.
5. Tidally forced seismicity in the Coso volcanic field
It turns out that there are several studies that look at tidally induced seismicity in the Coso volcanic field.
Ultimately, the analysis in the paper does not compellingly demonstrate tidal forcing of the Paxton Valley Fault. However, there is a well-known source of tidally induced seismicity in the area. The Coso volcanic field is a very young, active, basaltic volcano complex, with large basalt flows, scoria cones, etc; it is well known to exhibit tidal forcing of small earthquakes. In particular, the Coso geothermal field - a central part of the volcanic complex - has been demonstrated to be sensitive to tidal triggering as well as far-field seismic triggering. Studies of tidal triggering have previously mapped out areas within and surrounding the Coso volcanics that appear to exhibit some tidal forcing of earthquakes. A map of tidally forced areas was presented by Wang et al. (2022). This map shows that areas of tidal forcing extend in a north-south band from the Coso mountains, through the Coso basin, and towards Ridgecrest, crossing the northwestern end of the Paxton Valley Fault Zone.
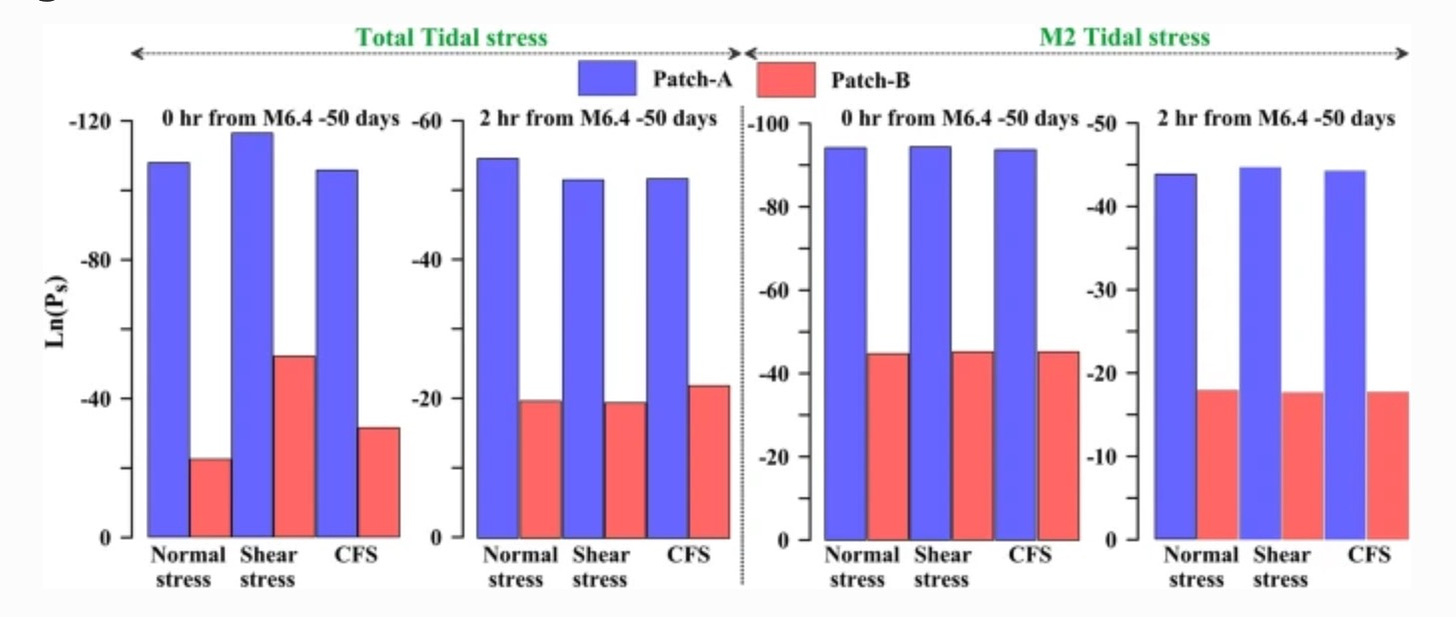
A new study, published at almost the same time as the GRL paper, showed that aftershocks of the Ridgecrest sequence exhibit tidal forcing, but only in the northwestern section beneath the Coso basin (in the northwestern part of the rupture). Because aftershock sequences obscure very small earthquakes, the smallest magnitude events in this other analysis are ~M2+. We don’t have the stamina to analyse another paper (and honestly if you have made it this far you are a real trooper), but the analysis is simple enough that it seems reliable.
Finally, the control box presented in the GRL paper’s supplement is located in the Coso fault system, and apparently shows tidal modulation. However, because the plots lack confidence intervals, it is unclear how to compare the signal to the main result.
Together with the swarm-type seismicity observed in 2015 described above, it looks to us like tidal forcing in the area of the Paxton Valley Fault is a feature of the nearby, distributed fault systems, and not the Paxton Valley Fault itself.
In particular, the central part of the Paxton Valley Fault where the mainshock nucleated and where large slip happened, which as presumably the part of the fault closest to failure in the years leading up to the earthquake, has not been implicated as a source of tidally forced earthquakes in any study. This leads us to believe that many of the problems seen in the paper, such as high sensitivity to choice of bounding box and to specific earthquake clusters that are normal-faulting events, are because the Paxton Valley Fault intersects with this other, distributed, fault zone, where earthquakes seems to be sometimes tidally forced. Any futher study should seek to exclude these effects more carefully before discussing the tidal behavior of the Paxton Valley Fault itself.
6. Summing up - finally
Can the sensitivity of a fault to tidal forcing tell us something about how “primed” it is to fail? Maybe. Based on our analysis of the Beaucé et al. (2023) paper, we do not think a link has been shown at Ridgecrest. Perhaps a simpler fault zone, not surrounded by areas with variable and tidally induced seismicity, would be a more suitable place to look for this effect. However, there is no a-priori reason to believe that a change in the tidal sensitivity of faults heralds future earthquakes - so we are not particularly optimistic that a general link will be discovered.
Critically, negative results - i.e. we looked but didn’t see it - will be very important if this method is actually applied to other fault zones in the future. After all, seeing one thing one time for one fault has never been sufficient evidence for a general process. For example, the Ridgecrest mainshock was preceded by a large foreshock on an orthogonal, cross-cutting fault. Despite the fact that this was 100% true and proved - much more confidently than the signal shown in this paper - this does not mean that we expect similar behavior prior to other large earthquakes. The geological variation between large faults is simply too great for this level of generalization. Whether high-impact journals will want to publish negative results about tidal triggering prior to big earthquakes remains to be seen.
Our final conclusions?
The measurements made in this study don’t appear to say much, or even anything, about the Paxton Valley Fault. Therefore, the strong claims made by Beaucé et al. (2023) and promoted by Tsai (2023) about discovering a new way to see “preparatory” behavior is not valid. Geophysical behaviors should necessarily relate to geology; strong claims of unusual behavior should look at both.
The paper is very challenging for non-specialists, even seismology-proximal ones (like us) to understand. The spatial and temporal dimensions are mixed together in unexpected ways, making it difficult to understand where the signal actually comes from. The non-binned and non-smoothed data are never plotted, even in the supplement, and it is difficult to assess what the time series really mean. The p-value calculation represents a very specific test about the data, but does not speak to whether any conclusions about the signal are valid. Finally, the lack of provided code means that even the basic calculations can’t be validated directly, and replicating the results would possibly require months of work (this post took a few days to put together - we aren’t willing to go much farther than this!).
We haven’t discussed the paper with the authors, and if we are wrong about any part of this discussion we will gladly update the post.
References:
Beaucé, E., Poli, P., Waldhauser, F., Holtzman, B. and Scholz, C., 2023. Enhanced tidal sensitivity of seismicity before the 2019 magnitude 7.1 Ridgecrest, California earthquake. Geophysical Research Letters, 50(14), p.e2023GL104375. https://doi.org/10.1029/2023GL104375
1 comment on PubPeer (by: Judith Hubbard)
Bletery, Q. and Nocquet, J.M., 2023. The precursory phase of large earthquakes. Science, 381(6655), pp.297-301. https://doi.org/10.1126/science.adg2565
1 comment on PubPeer (by: Judith Hubbard)
Bradley, K. and Hubbard, J., 2023. Earthquake precursors? Not so fast. Earthquake Insights. https://doi.org/10.62481/310cc439
Cheng, Y., Hauksson, E. and Ben‐Zion, Y., 2023. Refined Earthquake Focal Mechanism Catalog for Southern California Derived With Deep Learning Algorithms. Journal of Geophysical Research: Solid Earth, 128(2), p.e2022JB025975. https://doi.org/10.1029/2022JB025975
Ross, Z.E., Idini, B., Jia, Z., Stephenson, O.L., Zhong, M., Wang, X., Zhan, Z., Simons, M., Fielding, E.J., Yun, S.H. and Hauksson, E., 2019. Hierarchical interlocked orthogonal faulting in the 2019 Ridgecrest earthquake sequence. Science, 366(6463), pp.346-351. https://doi.org/10.1126/science.aaz010
Scholz, C.H., Tan, Y.J. and Albino, F., 2019. The mechanism of tidal triggering of earthquakes at mid-ocean ridges. Nature communications, 10(1), p.2526. https://doi.org/10.1038/s41467-019-10605-2
Senapati, B., Panda, D. and Kundu, B., 2023. Solid-earth tidal modulations of 2019 Ridgecrest earthquake sequence, California: any link with Coso geothermal field?. Journal of Seismology, pp.1-15. https://doi.org/10.1007/s10950-023-10166-4
Tsai, V., 2023. Earthquakes have preparatory stage years before rupture. EOS. https://eos.org/editor-highlights/earthquakes-have-preparatory-stage-years-before-rupture
Wang, W., Shearer, P.M., Vidale, J.E., Xu, X., Trugman, D.T. and Fialko, Y., 2022. Tidal modulation of seismicity at the Coso geothermal field. Earth and Planetary Science Letters, 579, p.117335. https://doi.org/10.1016/j.epsl.2021.117335

