The great tidal earthquake hypothesis test part IV: Can tides warn us of upcoming large earthquakes?
We re-examine claims of precursory tidal triggering before large earthquakes.
Citation: Bradley, K., Hubbard, J., 2024. The great tidal earthquake hypothesis test part IV: Can tides warn us of upcoming large earthquakes? Earthquake Insights, https://doi.org/10.62481/d782982b
This is the fourth in a series of posts about whether earthquakes are influenced by tidal forces - and whether such influence might be able to tell us about upcoming large earthquakes. While this is certainly an “expert level” topic, we have tried to write it so that interested but non-geophysical readers can follow along.
First, we explain why tides might trigger more earthquakes as a large earthquake approaches. Then, we replicate the results of several highly cited papers that claim to see this happen for several large earthquakes. After that, we directly test the hypothesis against a much larger set of earthquakes.
We see that the vast majority of large thrust earthquakes show no precursory tidal signal. In fact, the number of earthquakes exhibiting increased tidalicity is the same as what you would expect for a random dataset.
We encourage you to revisit our first post in this series, which explains some of the theory, our second post, which summarizes and compares global studies about tidal seismicity, and our third post, where we replicate and test those studies. In our next (and hopefully final?) post on this subject, we will take a look at some specific tectonic settings, where links between earthquakes and tides appear to be much more confidently identified.
A quick note: Like in many of our posts, we are not experts in this field. We are learning as we go. We may get things wrong occasionally. The data we are using are available for download in our third post. If anyone identifies an error, we will happily update this post!
Part 1: Why would tides help us predict large earthquakes?
“It is of the nature of rock fracture and friction,” writes Dr. Christopher Scholz, in the classic textbook The Mechanics of Earthquakes and Faulting, “that the breakdown instability does not occur without some preceding phase of accelerated deformation.” This idea, supported by laboratory experiments and foundational to various models of fault behavior, has driven a search for subtle signals of imminent large ruptures.
Basically, although earthquakes usually seem to happen suddenly and without warning, theory says that they should have a slower startup-phase, which might - or might not - be detectable.
Tectonic stresses on and around faults increase incrementally, over years, decades, and centuries. Sometimes, these stresses jump suddenly - becoming much higher or lower - due to the effect of nearby earthquakes. Meanwhile, small ruptures are always happening, sometimes on the main fault, sometimes on other nearby fractures. Eventually, one particular small rupture wins the lottery and grows large enough to make the news. This happens semi-periodically: not regularly enough to be useful for prediction, but with enough regularity that we can try to calculate “recurrence intervals”: the average time between large earthquakes, give or take about 100%.
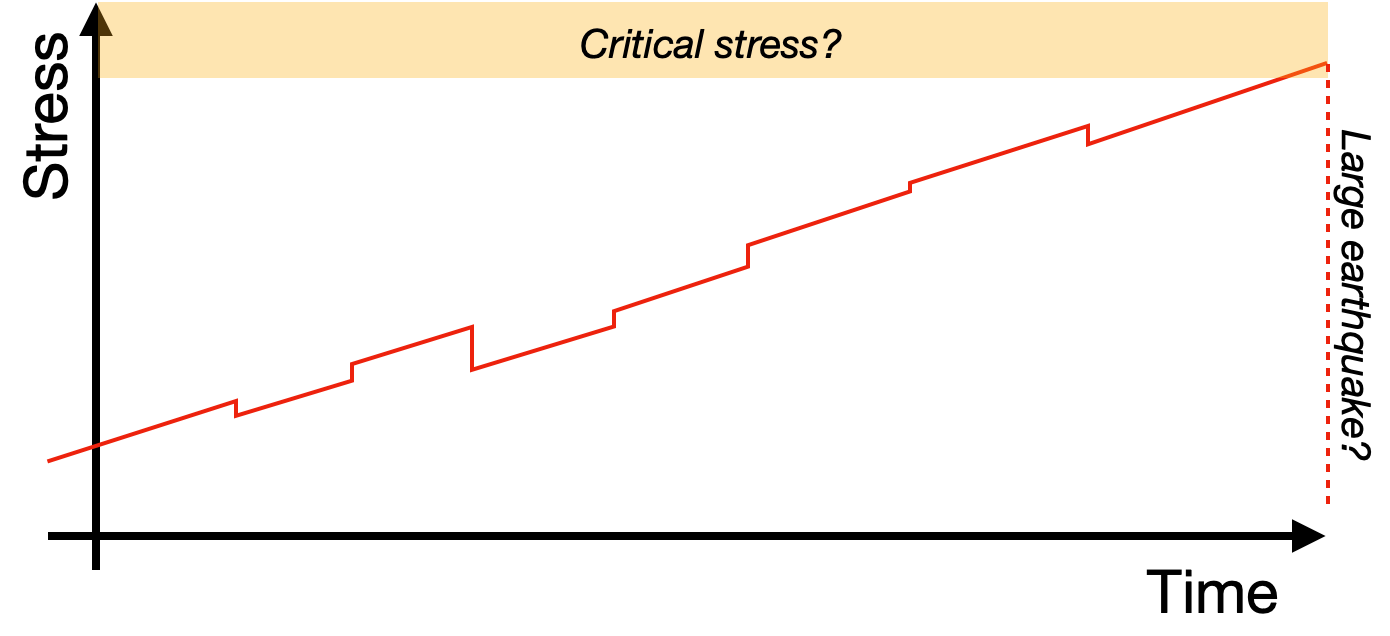
So, is there a practical way to identify a fault that is critically stressed - and especially dangerous? That is perhaps the most important practical question in earthquake science.
If we could get a sense of which faults on Earth are within decades, years, or even months, of large failures, it would fundamentally change the human relationship with earthquakes. So, people are obviously working on it.
There are several different symptoms that might theoretically be used to diagnose a near-critical fault. For instance, one might expect that a fault that is critically stressed would produce more earthquakes. And indeed, in 2001, Bowman and King identified a period of accelerating seismicity before large earthquakes on the San Andreas Fault. Unfortunately, the observations of Bowman and King were found to be statistically insignificant by Hardebeck and others in 2008. Many other possible symptoms - known as earthquake precursors - have been proposed, but to date none have panned out in practice.
So we come to the topic at hand: could the tidalicity of the earthquakes on and around a fault change as the fault becomes critically stressed? The idea is pretty intuitive. If a fault is almost ready to rupture, it makes sense that the very small but frequent stress changes imposed by the tides should be enough to push it past failure.
Laboratory studies have also shown that rocks do behave differently as they approach failure - with acoustic emissions (the sound waves generated by small abrupt fracturing) becoming more correlated with small changes in stress as the moment of ultimate fracture approaches. It is also possible to build a numerical model of faults that shows precursory tidalicity. So, lab and theory have long encouraged us to look closely at data from the real world.
The following figure summarizes the results of several studies that claim to see a strong tidal signal prior to notable earthquakes. All of these charts represent time series of binned data: observations from natural earthquakes. Each point represents an average over some period of time. While most of these studies use the p-value of the Schuster Test, where tidalicity is indicated by low values (see our posts I and III in this series for more details), Beaucé et al. (2023) use a different parameter that shows tidalicity when the value is larger (we wrote about their paper last fall).
To make the charts easier to read, we have added colored vertical bars: blue indicates the first deviation of the signal from assumed background levels, red marks the large earthquake. The two-headed arrow and text show the number of years during which an apparently anomalous signal was detected: this is the precursory phase where we might have (hypothetically) known that a large earthquake was on its way.
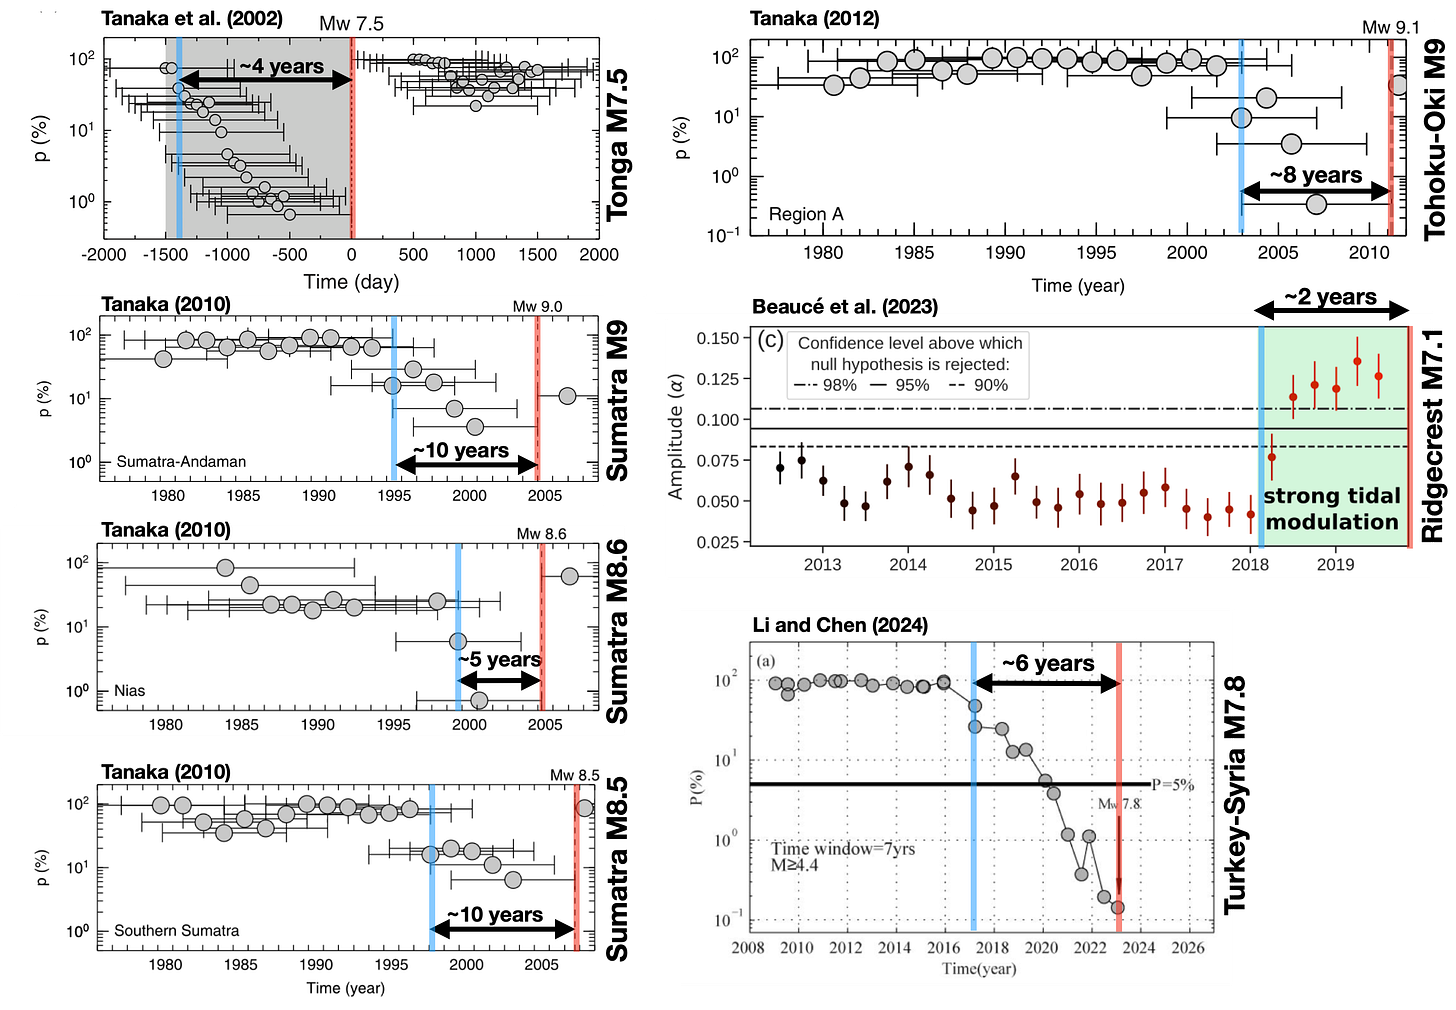
On their own, these figures are pretty compelling. That similar behavior was seen before multiple different earthquakes suggests a shared cause.
However, it is notable that the publication date of these papers always postdates the earthquakes: (1982 EQ → 2002 paper), (2004,2005,2007 EQ → 2010 paper), (2011 EQ → 2012 paper), (2019 EQ → 2023 paper), (2023 EQ → 2024 paper). This phenomenon is common to virtually all earthquake precursor studies - prediction turns out to be much harder than… uh… postdiction.
We think it is important to find out whether these observations of precursory tidalicity are 1) real and 2) meaningful.
So, the remainder of this post is divided into two topics.
Part 2: Can we replicate the precursory p-value drops using similar data and methods? Mostly, the answer is yes. Below, we replicate the results of Tanaka et al. (2002b), Tanaka (2010), and Tanaka (2012).
Part 3: Are the signals actually meaningful? There are a lot of ways to address this question, and in the process of writing this post, we explored many of them. Actually, WAY too many of them. In the end, we decided to cut out the chaff and focus on what we think is the most compelling approach: applying the method of Tanaka et al. (2010) to all M7.5+ thrust earthquakes, globally. Is there a compelling correlation between p-value drops and upcoming large earthquakes? (Spoiler: no.)
OK, let’s jump in.
Part 2: Replications
The first step to testing a published method is to make sure that we can replicate the previous results. In our previous post, we replicated global-scale studies of tidal triggering, using the same data catalog. But does our replication still work, when we look at individual areas that hosted large earthquakes?
First, we gathered the parameters used in the three studies we will replicate. Each study selected earthquakes differently or binned the data differently. Feel free to gloss over this table, eyes appropriately glazed. It will be here if you need it.
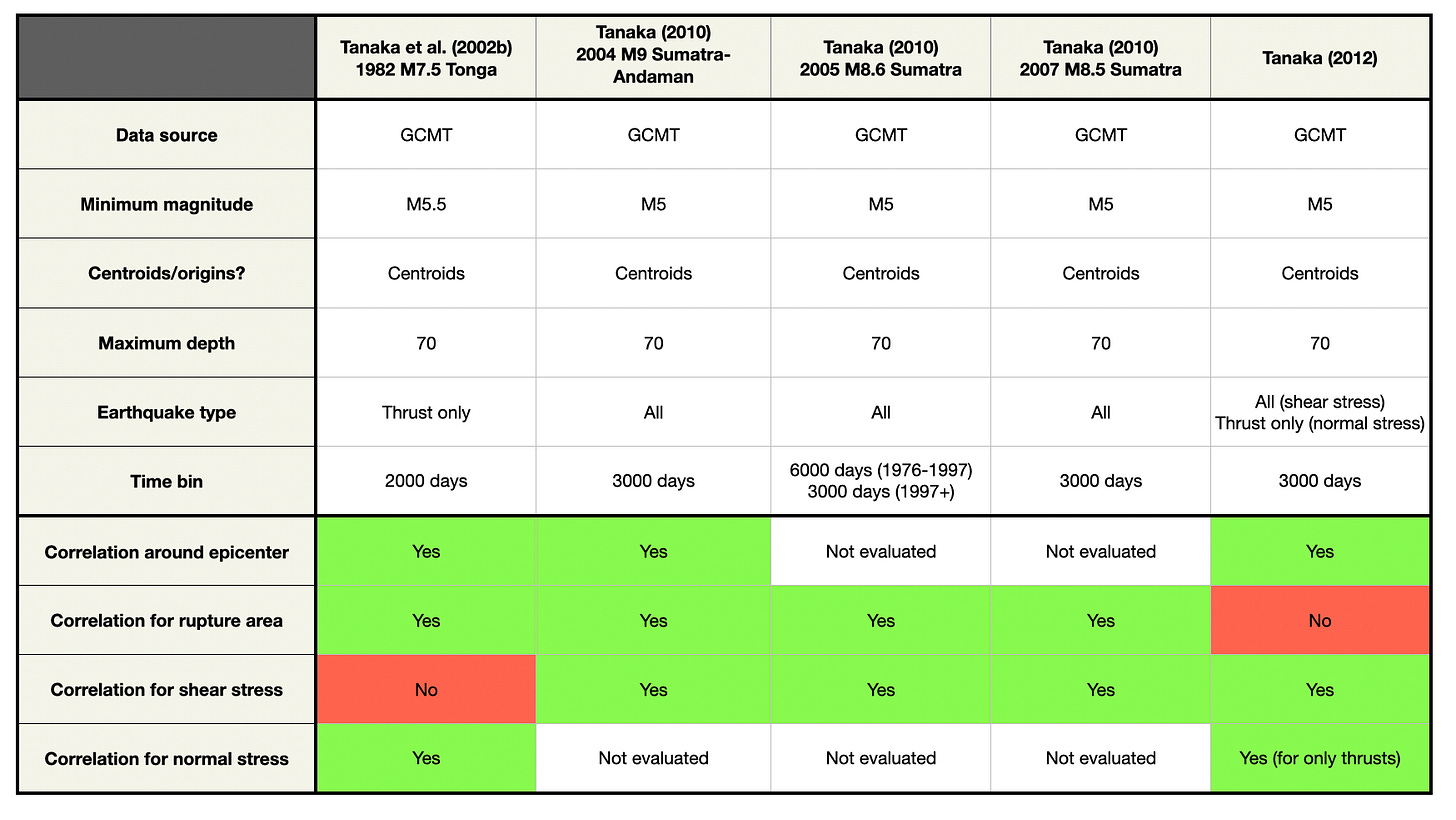
Ok, so what do our replications look like?
Tanaka et al. (2002b)
Earthquake studied: 1982 M7.5 Tonga
Tanaka, S., Ohtake, M. and Sato, H., 2002b. Spatio‐temporal variation of the tidal triggering effect on earthquake occurrence associated with the 1982 South Tonga earthquake of Mw 7.5. Geophysical Research Letters, 29(16), pp.3-1. https://doi.org/10.1029/2002GL015386
Tanaka et al. (2002b) looked at precursory tidal triggering before a Mw7.5 earthquake in South Tonga, which happened in 1982.
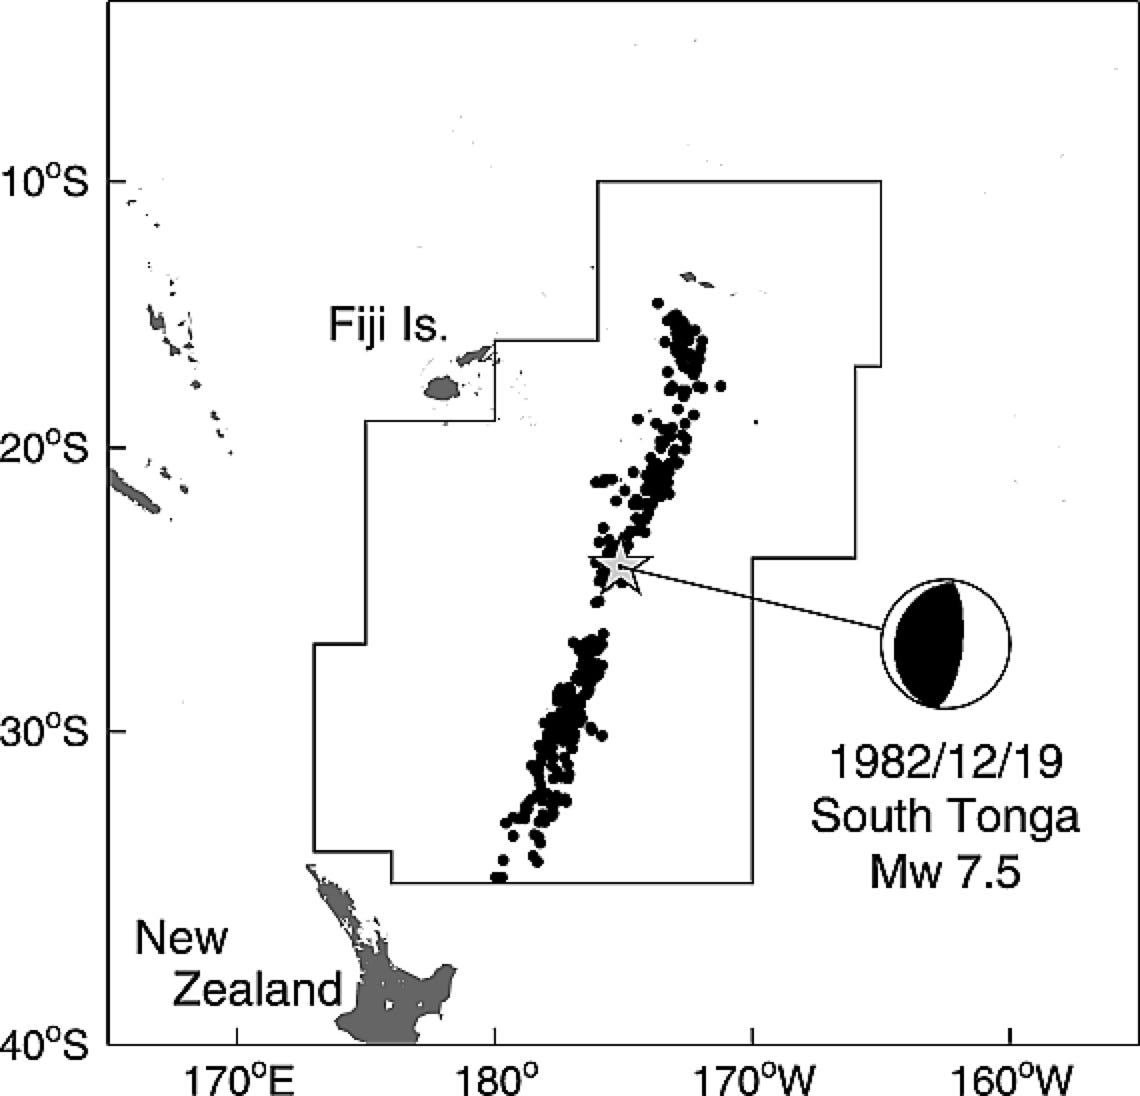
For this study, we first replicated the full dataset at centroid locations. We recover a similar histogram for normal stresses, including a low p-value with a peak phase near 0°. Our shear stress histogram is pretty different, but since the original study found no correlation with shear stress, it doesn’t seem very important (it turns out that calculating shear stress phase on these faults is particularly fraught - the curious can inquire with us directly or in the comments).

When we break the data down into the pre- and post-earthquake periods, we also find results that are broadly similar to those of Tanaka et al. (2002b).

The primary result of this paper was that the p-value of normal stress decreased over the 2000 day period before the earthquake, and then recovered to higher values afterward. Our time series show similar patterns.
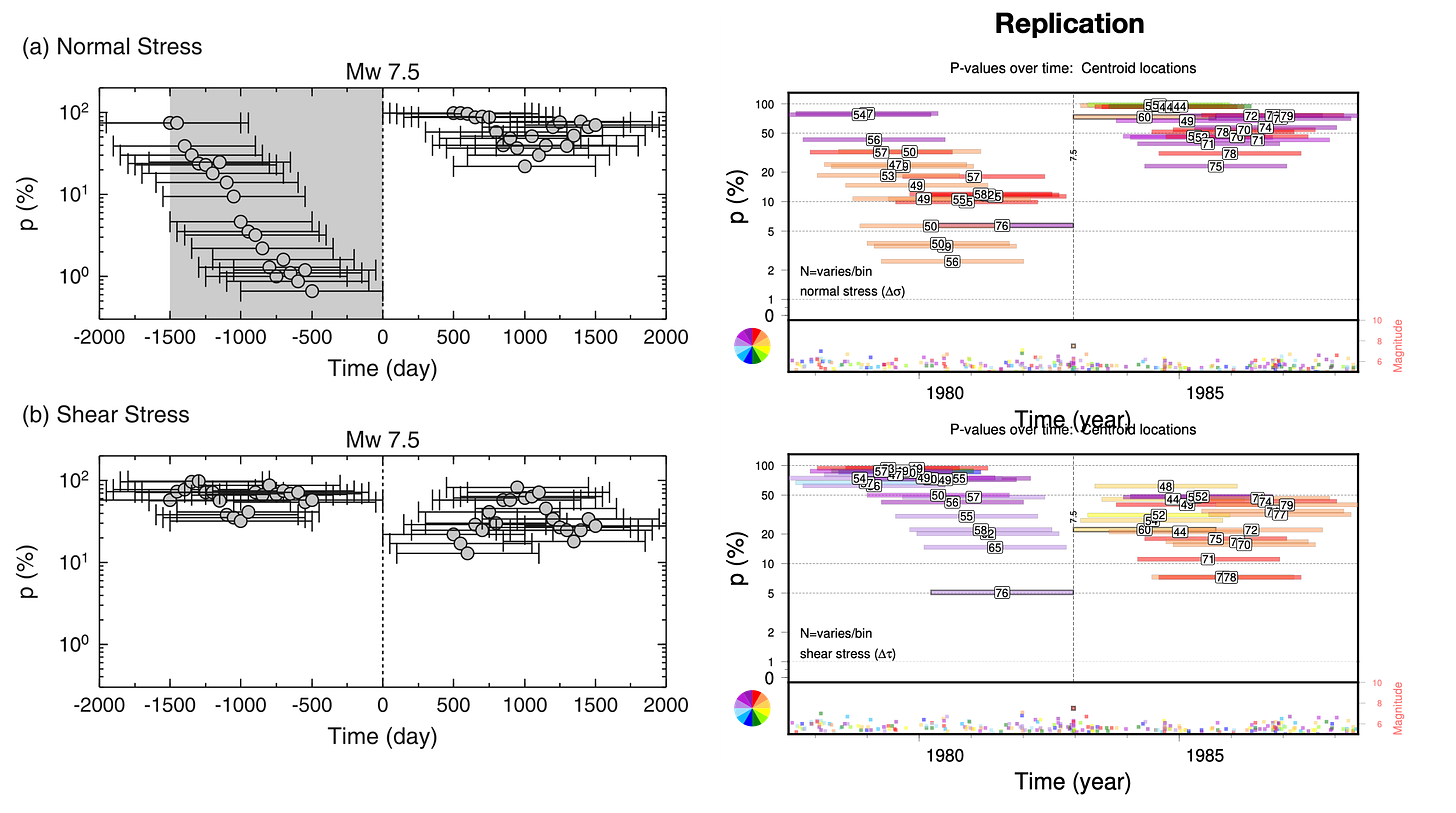
Tanaka et al. also calculated the p-value for earthquakes binned by latitude, and found that the strongest correlation was near the hypocenter of the Mw7.5 earthquake. We binned our earthquakes along an actual profile line, and found similar, but not identical, results. Again, the shear stress replication is less successful.
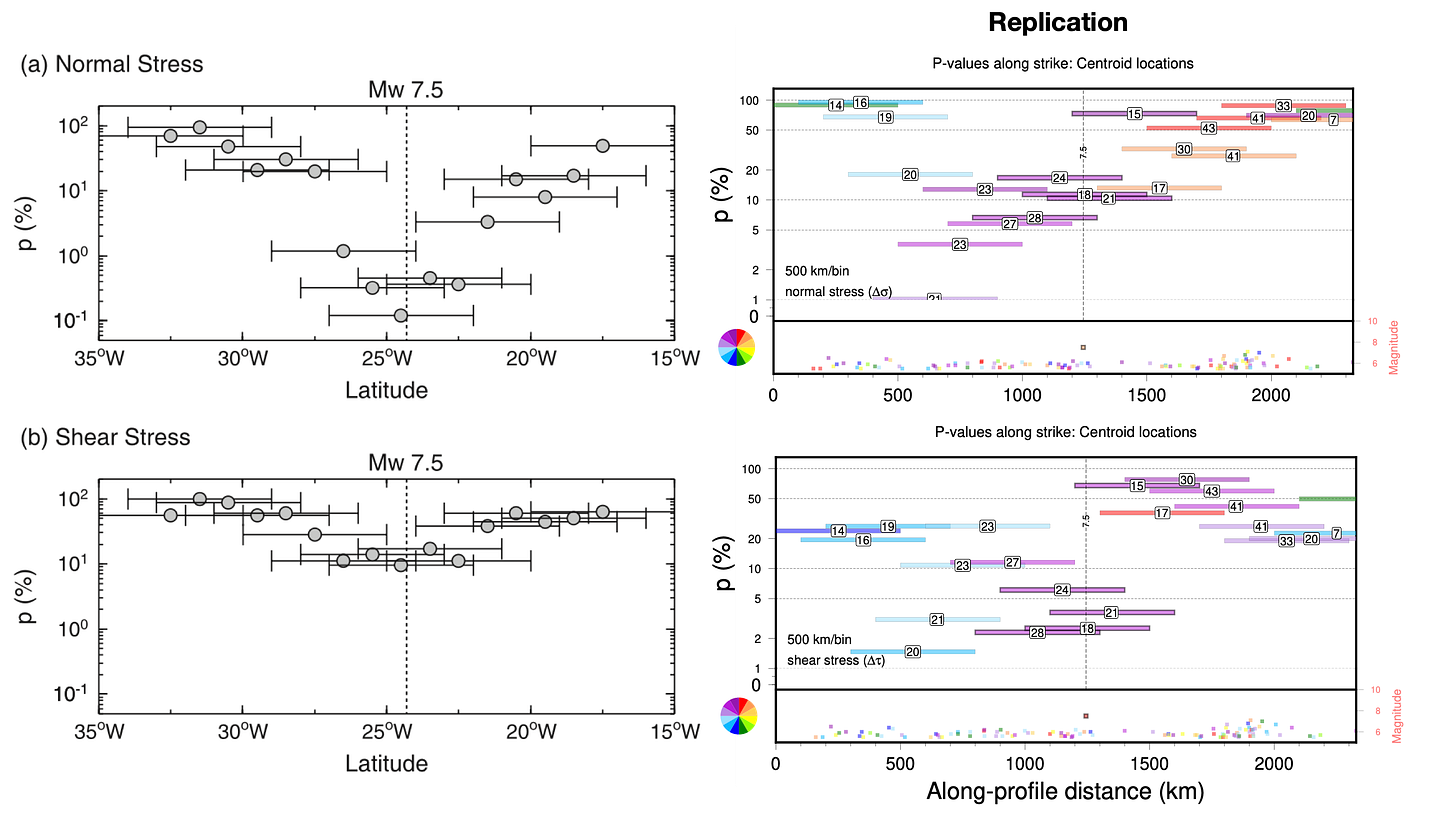
In the end, we conclude that the apparently precursory tidal signals proposed by Tanaka et al. (2002b) are reasonably replicable.
Let’s move on to some more famous earthquakes.
Tanaka (2010)
Earthquakes studied: 2004 M9.0 Sumatra; 2005 M8.6 Sumatra; 2007 M8.5 Sumatra
Tanaka, S., 2010. Tidal triggering of earthquakes precursory to the recent Sumatra megathrust earthquakes of 26 December 2004 (Mw 9.0), 28 March 2005 (Mw 8.6), and 12 September 2007 (Mw 8.5). Geophysical Research Letters, 37(2). https://doi.org/10.1029/2009GL041581
Tanaka (2010) examined earthquakes along the Andaman-Sumatra section of the great Sunda megathrust. Between 2004 and 2010, this fault experienced a cascade of great earthquakes. The cascade began with the 26 December 2004 M9 Sumatra-Andaman earthquake; this was followed a few months later by the 23 March 2005 M8.6 Nias earthquake. On 2007, a complex earthquake sequence occurred near Bengkulu, farther to the south.
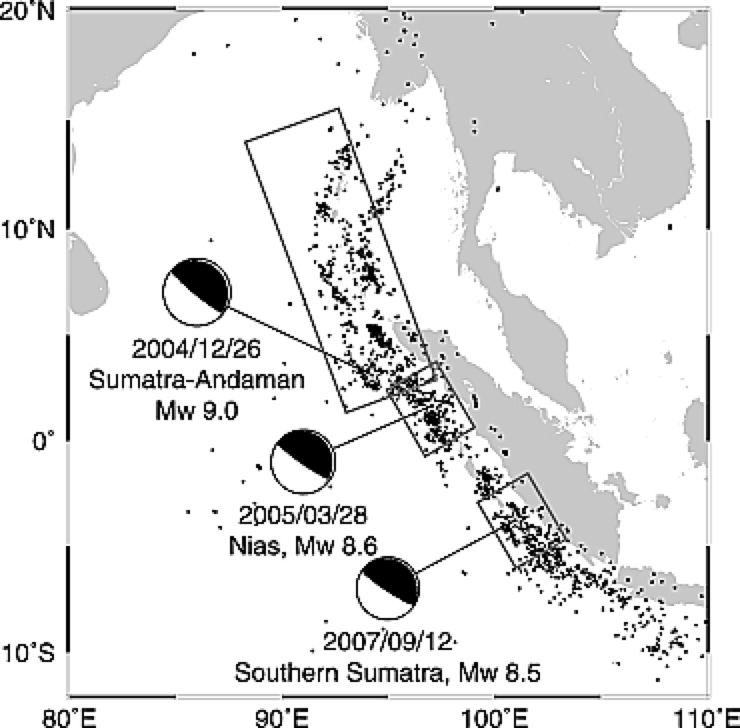
Tanaka proposed that each of these three earthquakes was preceded by precursory tidalicity in shear stress, in which the p-value of time-binned earthquakes decreased to near 0 over the decade prior, and then recovered to values near 1 immediately after the earthquake.
The following figures show Tanaka’s results, with our replications for centroid locations. The p-values are plotted against time, with the histogram from the last bin just prior to the large earthquake is shown to the right.
2004 earthquake
2005 earthquake
2007 earthquake
In general, our p-value timelines are very similar to Tanaka’s, although the specific values are a little different. The histograms of tidal phases are not exactly the same; our peak phase is always a few tens of degrees to the left. Taken together, this suggests that there might be a consistent bias between the shear stress phase we calculate, and theirs (again, those interested may inquire within).
It is also important to note that this study did not sub-select for thrust earthquakes, instead including a wide range of earthquakes that are clearly not related to the Sunda megathrust.
In any case, we conclude that we can also replicate the basic results of Tanaka (2010).
Tanaka (2012)
Earthquake studied: 2011 M9.1 Tohoku-Oki, Japan
Tanaka, S., 2012. Tidal triggering of earthquakes prior to the 2011 Tohoku‐Oki earthquake (Mw 9.1). Geophysical research letters, 39(7). https://doi.org/10.1029/2012GL051179
Tanaka (2012) also examined the tidalicity of earthquakes leading up to the great 2011 Tohoku-Oki earthquake. When they repeated the approach of Tanaka (2010) by looking at the entire rupture area, they did not see a clear precursory signal:
While that seems like a failure of the previously successful method, it might be possible that a precursory signal exists in some sub-set of the overall data. Tanaka (2012) therefore searched over various sub-regions of the aftershock zone, ultimately finding that the area near the origin point of the great earthquake did show a precursory tidal signal.
When this subset of data is plotted in a timeline, a precursory drop in p-values is seen for tidal shear stress.
As usual, we replicated the study to the best of our ability by digitizing the selection box and running our own calculations.
We replicate the dramatic lowering of p-values before the mainshock. Once again, while our p-values are similar, our shear stress phase histograms are shifted from those of Tanaka (2012).
Part 3: Testing the hypothesis
So, our replications are pretty good. This means that the published signals do seem to exist within the data. This is not unexpected, because our calculation method is largely inherited from the prior work of Tanaka et al. (2002a).
However, this does not mean that those precursory signals are meaningful.
The p-value measures how unlikely it is that a given set of tidal phases might arise by chance. Thus, a p-value of 10% should arise 10% of the time, in a random dataset. A p-value of 1% should arise 1% of the time.
If you take one hundred earthquakes and look at the last bin of events that happened before the earthquake, even for random phases you should find (on average) five examples where the p-value was lower than 5% just prior to the mainshock. If you look at a timeline of events from a region, you should also see the p-value vary between 100% and 0% over time. These are simple facts about the nature of the p-value; they do not depend on the number of events that go into each bin.
If you allow yourself to look at multiple aspects of the seismicity — for instance, the shear stress or normal stress, for seismicity selected by type or taken all together, for a minimum magnitude of 5 or 5.5, at centroid or origin locations, for time bins of 3 or 4 or 5 or 10 years, for seismicity across the whole megathrust or just a small part, in a complete or declustered dataset — then suddenly it becomes much more likely that at least one of those combinations will yield low precursory p-values, for some earthquakes.
This situation is ripe for confirmation bias. Confirmation bias is the universal tendency to focus only on positive results - the ones that support our expectations and align with our dreams - while ignoring negative results. Academic publishing is particularly susceptible to confirmation bias, because no journal wants to waste its valuable (digital) ink reporting negative results.
To really assess the significance of precursory lowering of p-values, we think we have look at a much larger collection of earthquakes, and see whether low pre-earthquake p-values are more common than expected from random chance.
Luckily, once the tidal phase data have been calculated for the 63,720 events in our catalog, it is relatively easy to automate the production of p-value timelines. (We once again would like to thank our motley collection of computers, for keeping our basement office warm during this calculation.)
So, let’s make some timelines! First, we drew a selection box around the aftershocks of each M7.5+ thrust earthquake in the catalog. (Turns out there are 79 such events.) We made sure to give some room around the edges to account for the origin-centroid location uncertainty. This ridiculous and almost unintelligible map shows the events and their selection boxes:
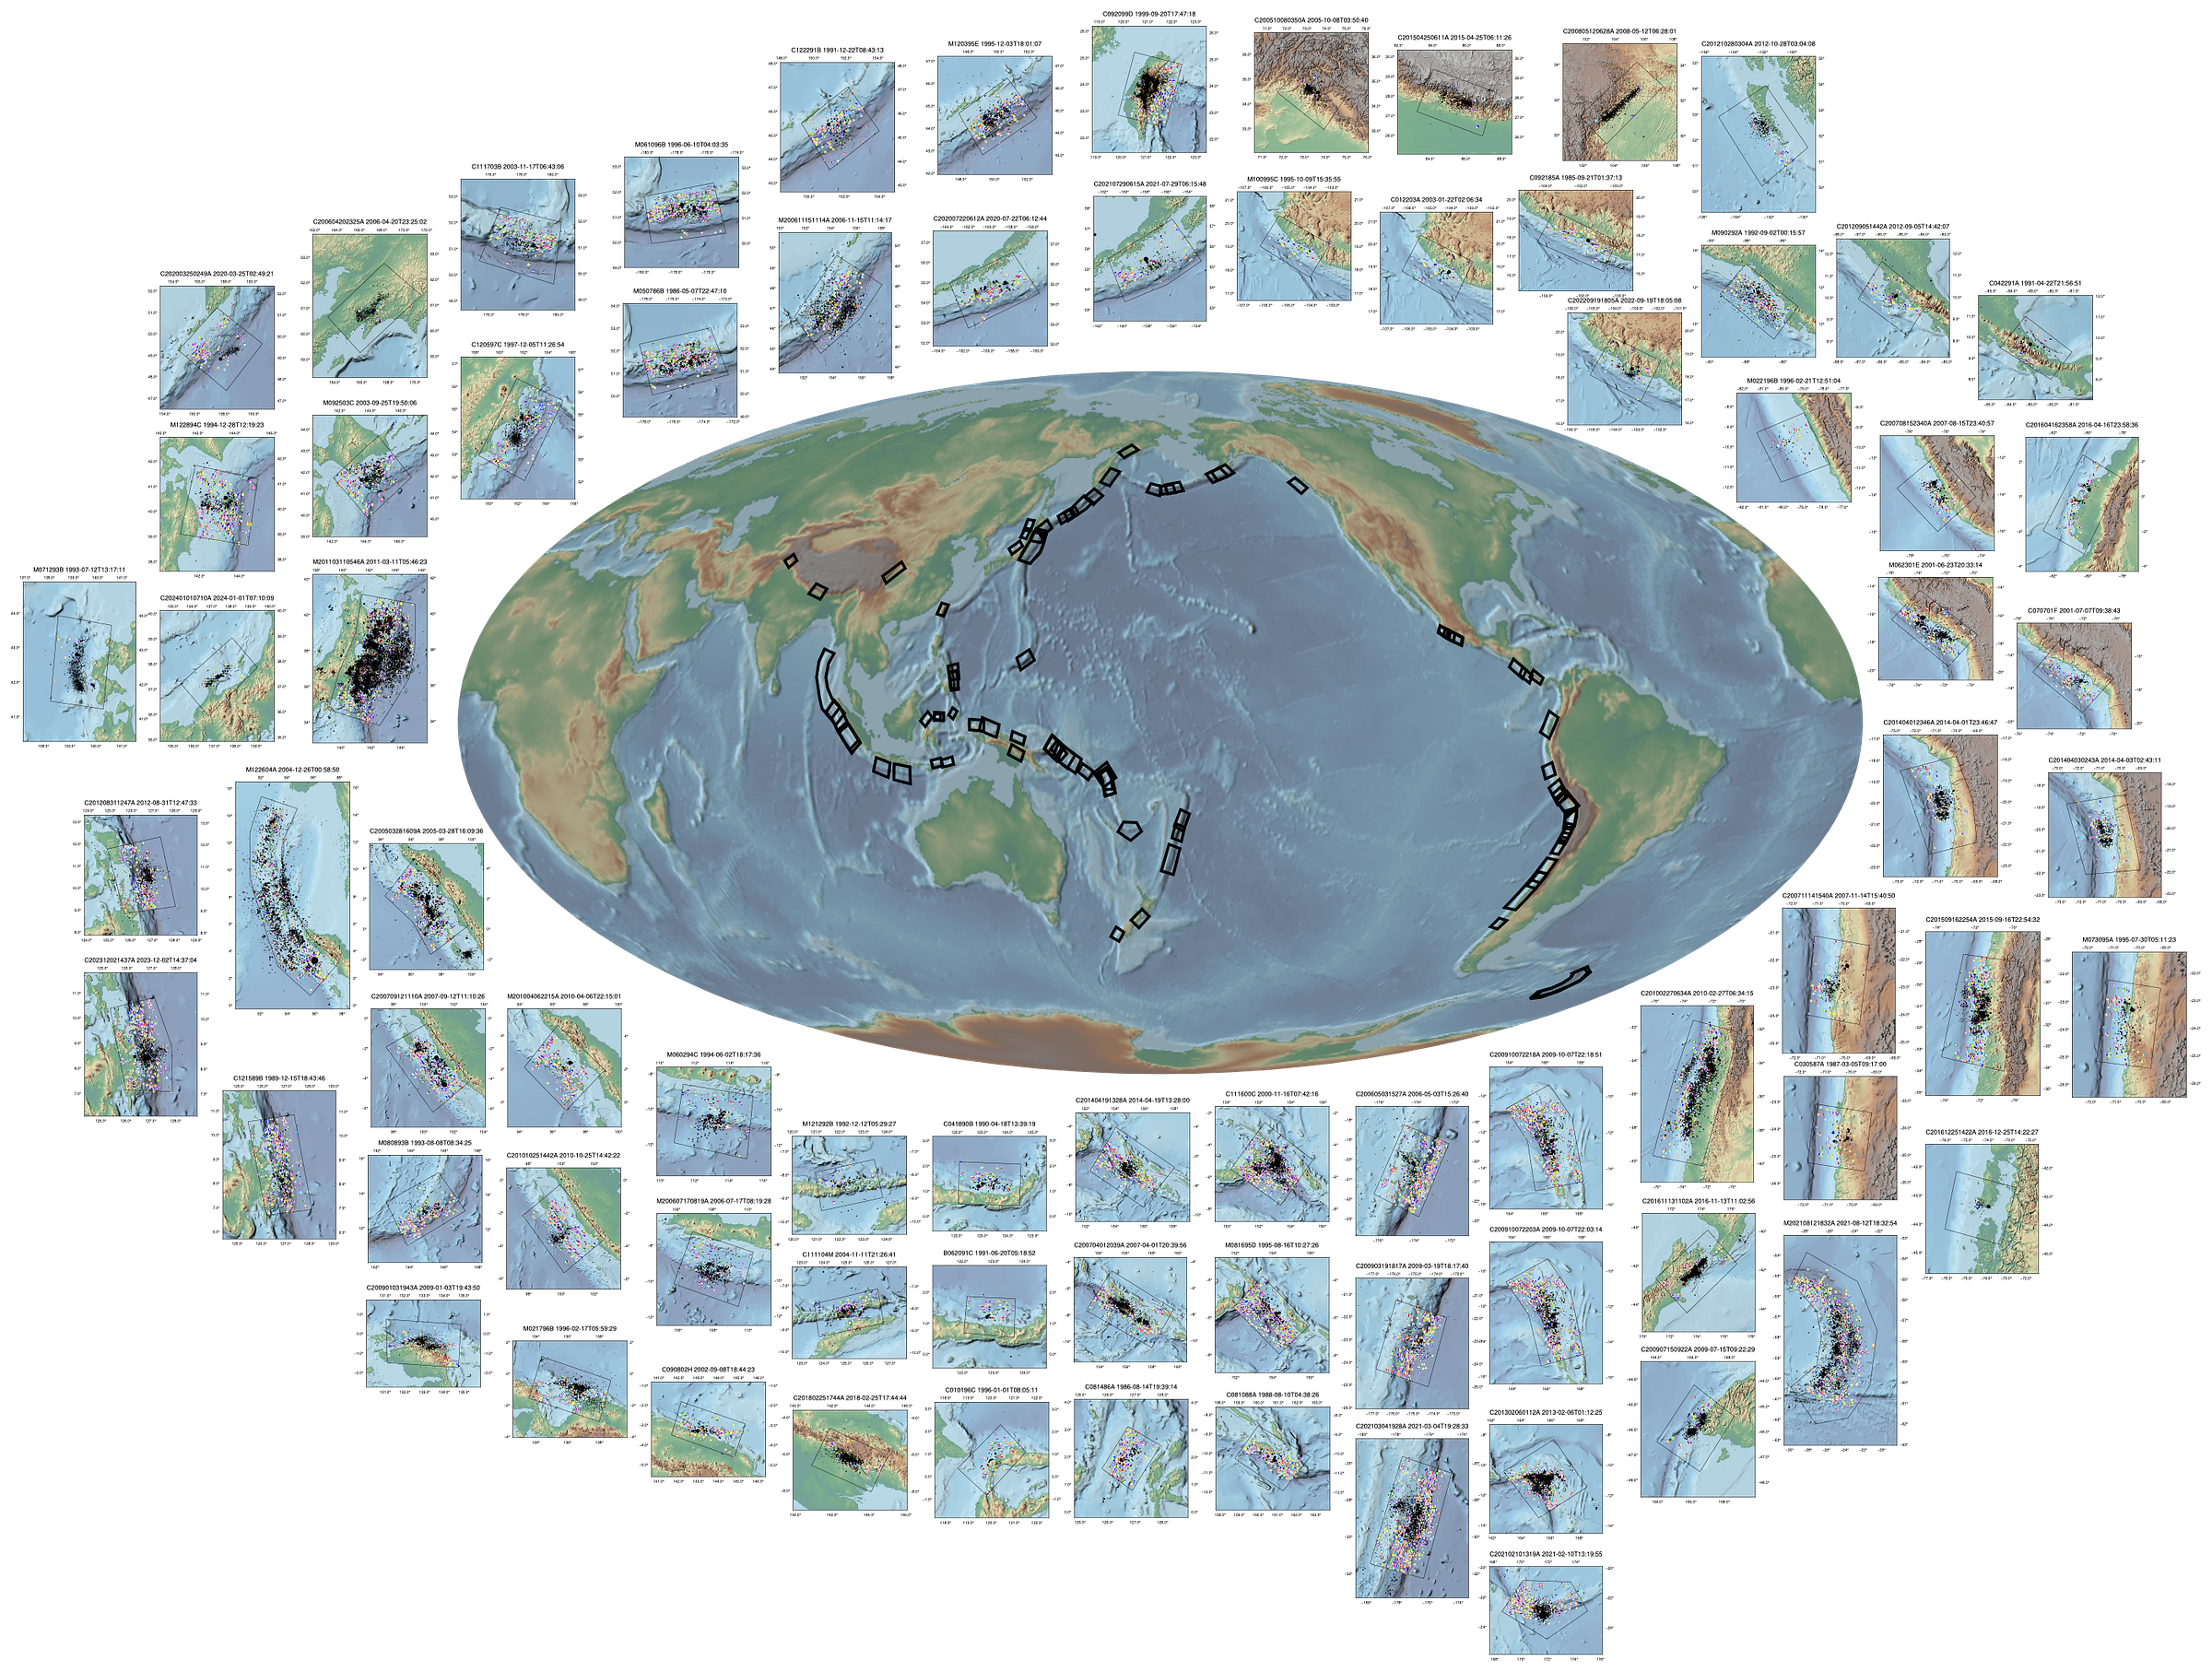
Following the approach of Tanaka (2010), we used all earthquakes falling within each box, with magnitude 5+ and a maximum depth of 70 km. We did not filter events based on earthquake type.
We calculated the p-value of the tidal shear stress phase at centroid locations, using 3000 day bins, with a 500 day increment for each bin. So far, this again matches the approach of Tanaka (2010).
We made two minor modifications. First, we defined the bins so that the ‘last’ bin before each target earthquake ends one week before the mainshock. This was intended to limit the influence of foreshock behavior on the last p-value before the mainshock. Second, we excluded any earthquake that happened within 24 hours of a previous nearby event. This reduces the effect of aftershocks that may tend to have similar tidal phases; we did this because these events seem much more likely to be triggered by the previous earthquake than by tidal stresses.
In case these parameters disagree with you, rest assured that we also ran the calculations with other combinations of variables: thrust events only, at origins vs centroid locations, with and without aftershock removal, and with different bin widths (e.g. 1000 days instead of 3000). In no case did we find a more favorable overall result.
Here’s a quick guide to reading a p-value timeline. Basically, you are looking for a drop in the p-values in the decade before the large earthquake. Take note of how the p-value changes before each mainshock - the prediction of the theory - but also look at how it changes over other time periods, like long before or after the earthquake. The rainbow pattern on this sample time series is pretty, but purely coincidental. It is important to note, however, that only the violet, purple, red, and orange colors are associated with driving tidal stresses; the colors that fall on the bottom half of the phase color wheel (yellow through light blue) should not tend to cause earthquakes, theoretically.
Warning: If you are reading this post on a phone, prepare your backup thumb because your primary thumb may cramp from scrolling too far.
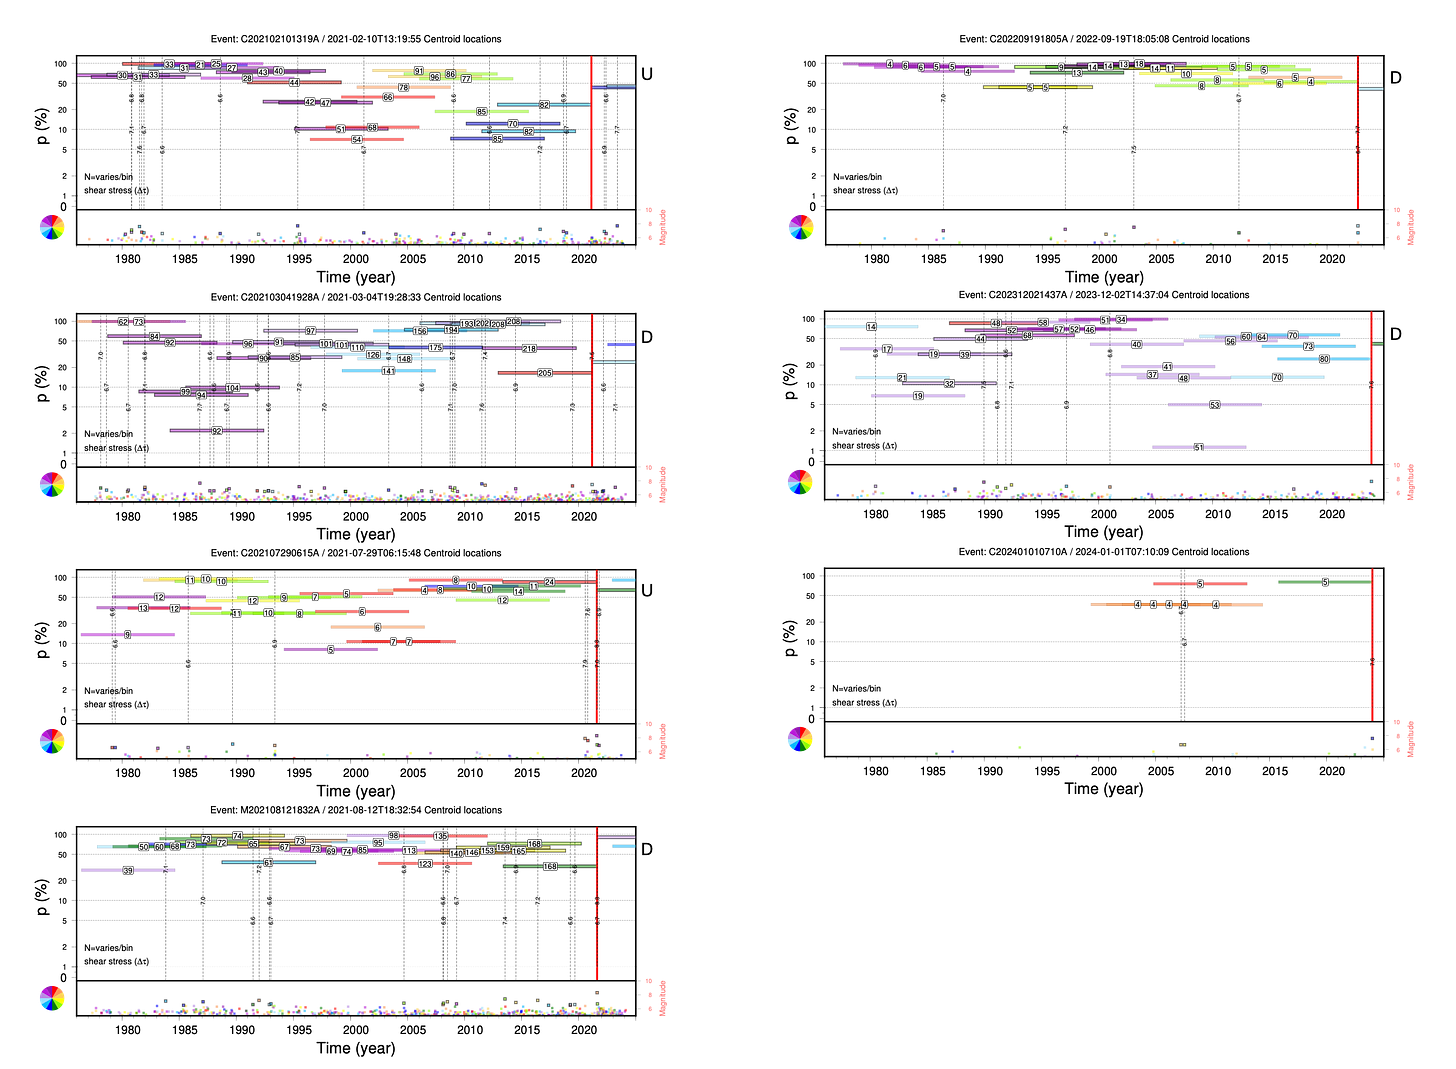
Okay, here we go! We have added a black box around any time series where the p-value drops to below 5% in the final pre-earthquake bin. Dashed black boxes indicate a suggestive pattern of “decreasing” p-value that does not meet this strict criterion.
(Take a minute to rest your thumbs.)
Okay, what do we see in these timelines?
Some mainshocks have too few earthquakes in the selection box to see any signal. Oh well.
A few earthquakes show a precursory lowering of p-values. These include most of the events already discussed in the literature, plus a few extras.
The large majority of earthquakes do not have low or decreasing p-values prior to the mainshock.
When we tally up the results, we see that the number of earthquakes with a p-value below 5% just before the mainshock is just what we expect from random variation - about 5% of the events with enough data to see something.
We collected all of the p-values from the final pre-earthquake bins, and put them in a histogram. Each bar in the histogram represents a 5% range - so, for a random dataset, we expect to see a value of ~5% in each bin. In contrast, if precursory tidal triggering is real, we should see many extra events in the farthest-left bins. So, is that the case?
No.
Out of curiosity, we counted how many times the p-value decreased between the second-to-last and last bins, and how many times it increased or stayed the same (the letters U = up, D = down, and N = no change are placed beside each timeline above). Fun fact: the increases outnumbered the decreases 36 to 25. So, we certainly can’t say that p-values tend to decrease leading up to the mainshock.
Things aren’t really looking up for the hypothesis at this point.
But wait, there's more! We have one more test we need to run.
Tanaka (2012) noted that the aftershock area of the 2011 Tohoku-Oki earthquake did not show a precursory signal, but events from around the area of the epicenter did show a precursory lowering of p-value. This also matches the earlier observation of low p-values near the epicenter of the 1982 Tonga earthquake.
So, this opens up the question of whether we should be looking near the origin or centroid points, rather than looking at the entire rupture area. However, it is important to note that this an alternative hypothesis - that the tidalicity will occur only near the earthquake’s origin - and represents a major shift of the goalposts.
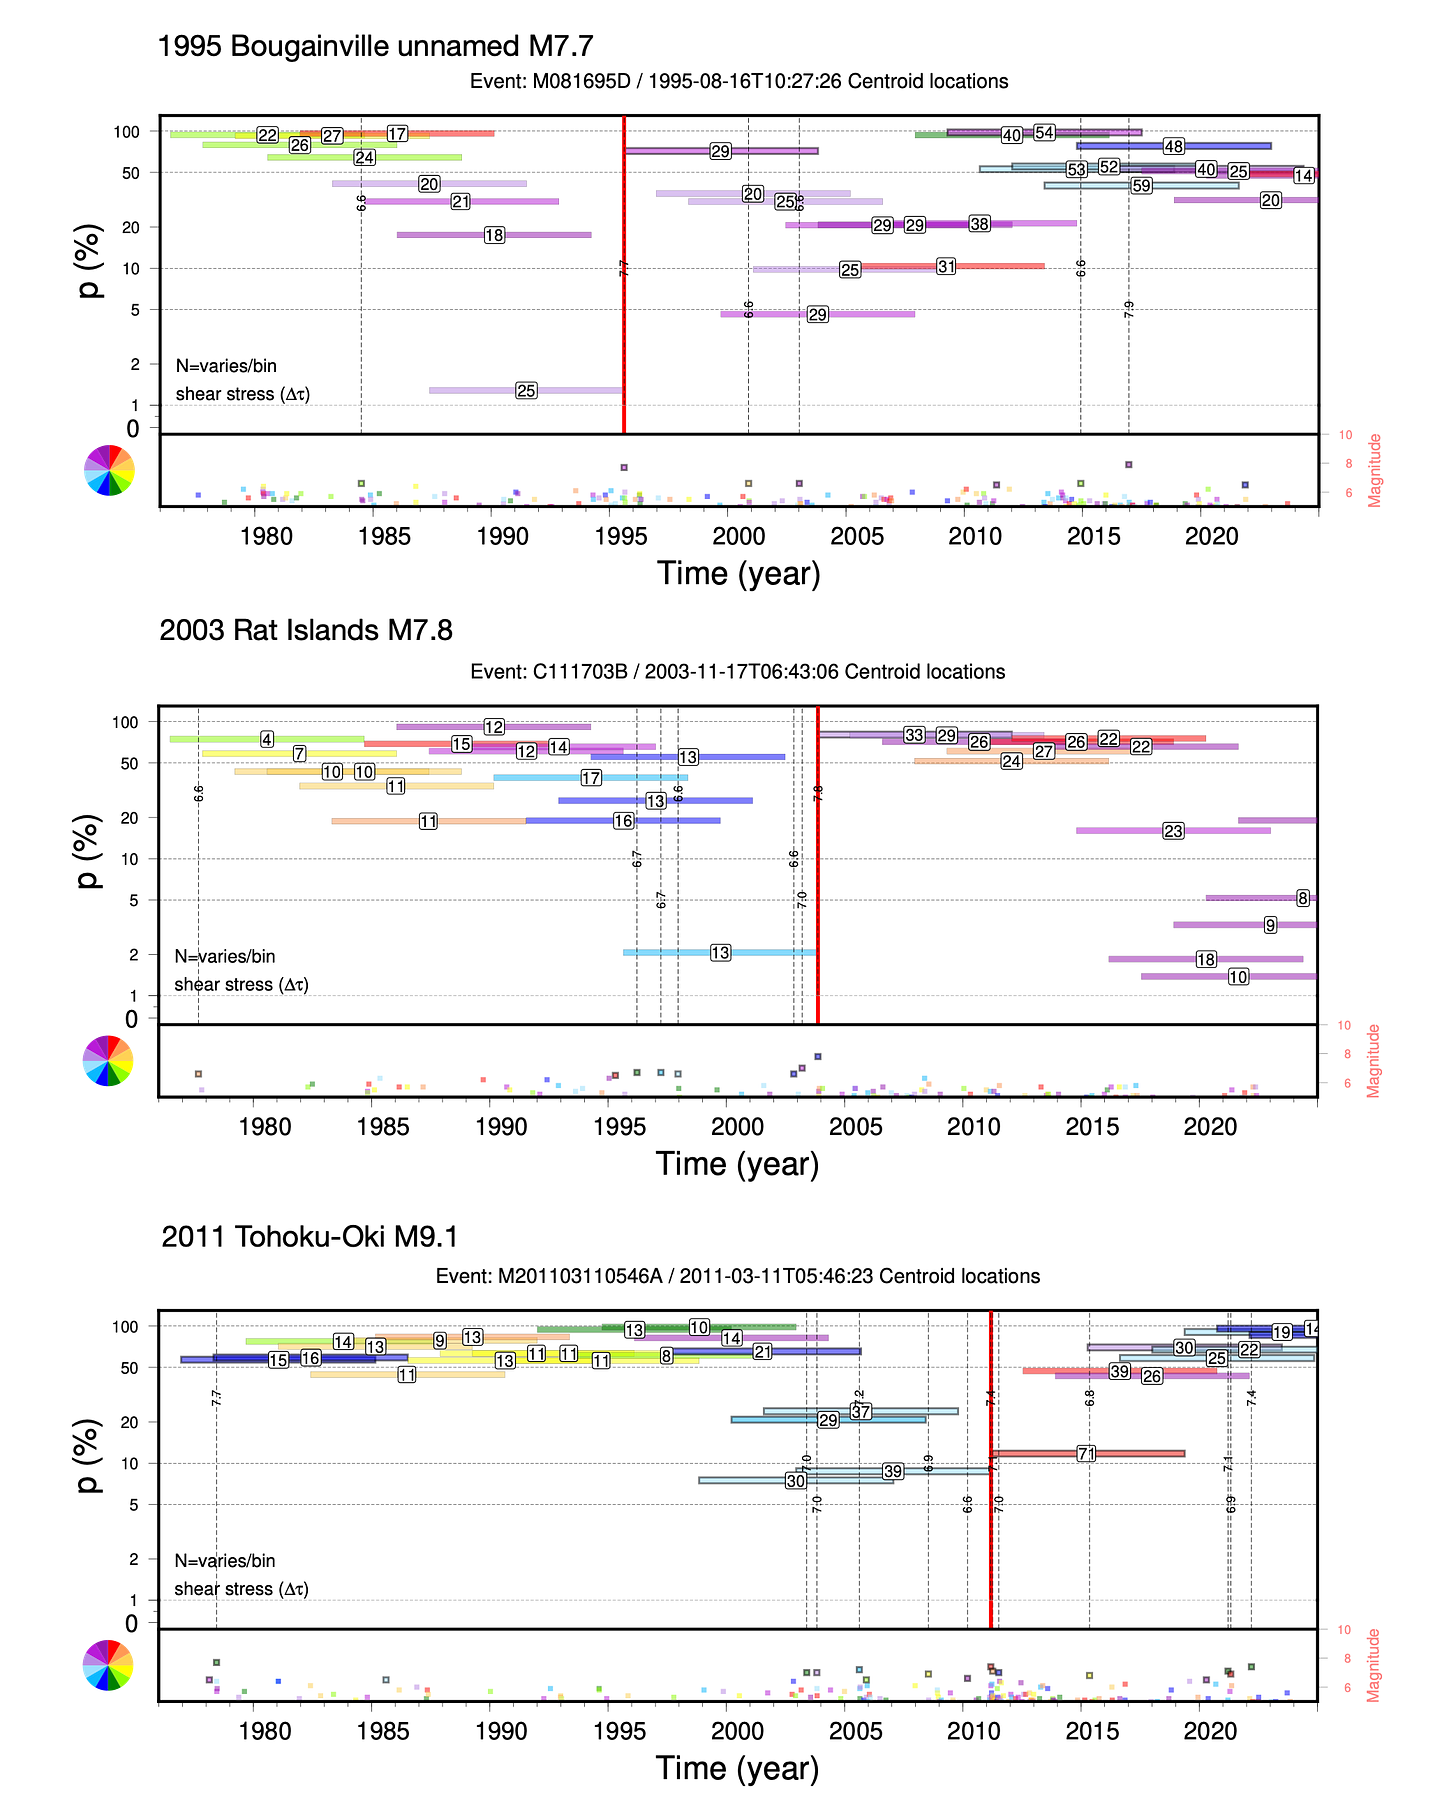
Anyway, we went ahead and tested the alternative hypothesis by selecting only events within a 100 km radius of the mainshock location. For earthquakes with small aftershock areas, this is basically the same result. For large rupture areas, there is a chance it is different.
We will save some scrolling energy and only show the earthquakes that do have a “precursory type” signal using this method. For centroid locations, we find only three plausible examples of precursory lowering. (Only two actually reach p-values below 5% in the final bin.)
For origin locations, we find only two plausible events. (Only one reaches a p-value below 5% in the final bin.)
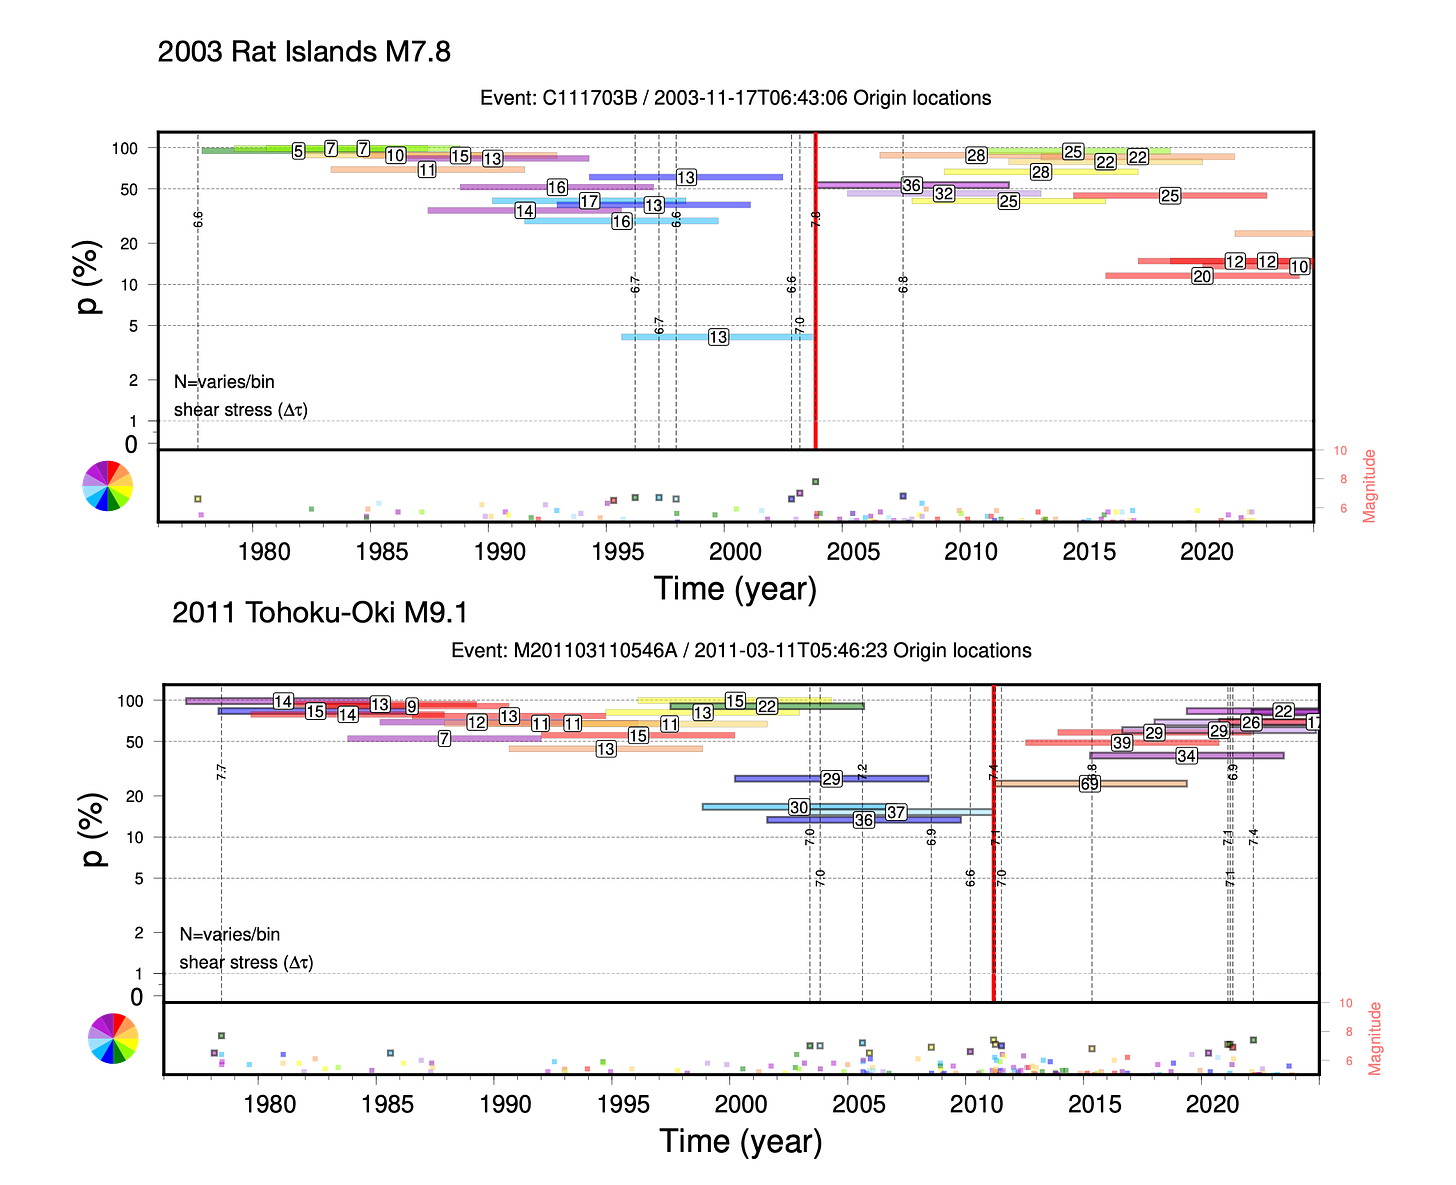
Thus, it appears that the precursory lowering seen near the Tohoku-Oki origin is a very special case, and is not common at all in the overall dataset. (But hey, it looks like we could publish a paper about tidal precursory signals prior to the 2003 Rat Islands earthquake! Don’t worry; we won’t.)
We note that the lowering of p-values before the Tohoku-Oki earthquake coincides with a cluster of fairly large earthquakes (M6.5-M7) that occurred close to the epicenter between 2003 and 2006. Thus, the “precursory” signal did not appear gradually over time - it appeared suddenly as a result of several large earthquakes and their long-term aftershocks. When we plot the timelines using a shorter bin duration of 1000 days, we see that the p-value actually recovered to high values before the mainshock.
OK, the tests are all done. What can we conclude?
The published events are rare examples where the hypothesized precursory p-value lowering actually occurs. The vast majority of other earthquakes show no precursory lowering. In fact, the number of “precursor” events seen is precisely what we would expect to see in random data. While we can turn a lot of different knobs to recover somewhat different patterns in the timelines, we have found no combination of parameters that shows a better (more tidalicious) signal than what we have shown here.
Thus, we believe that there is no statistical support for the proposed precursory tidal seismicity signal before large thrust events in the global CMT catalog.
We note that the precursory tidal earthquake hypothesis has been tested by two prior studies, using different approaches than ours.
Wang and Shearer (2015) examined a detailed earthquake catalog for Japan, and found no evidence to support the idea that there was precursory tidalicity before the 2011 Tohoku-Oki earthquake. Like us, they saw only the level of p-value variation expected from random chance.
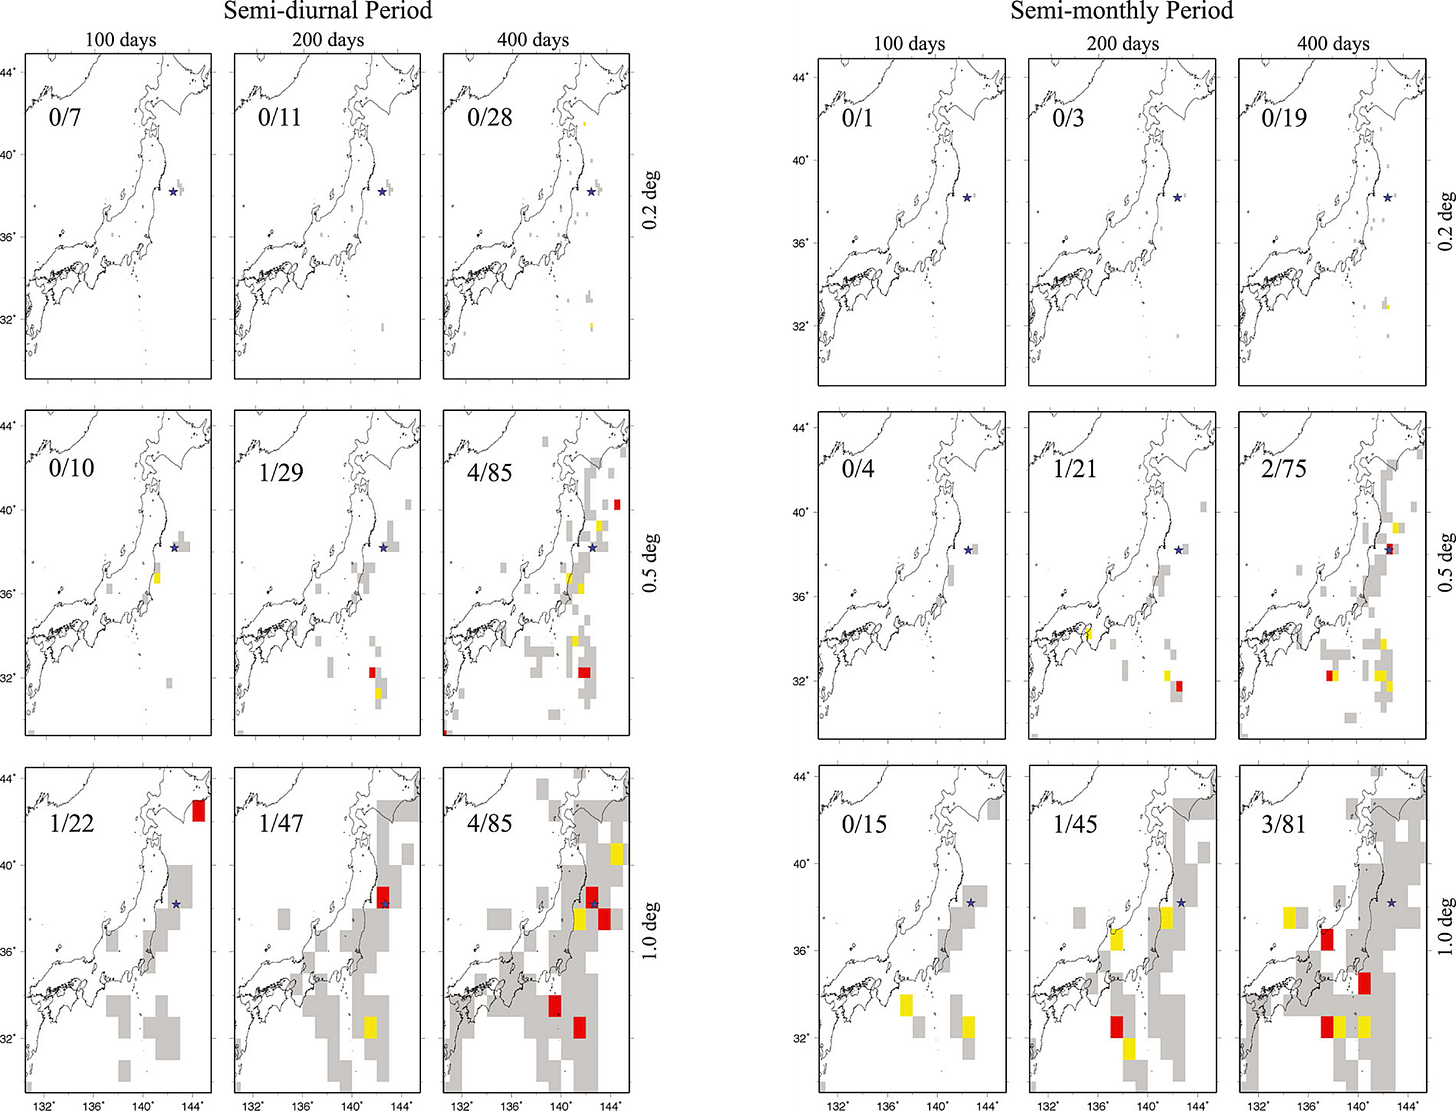
They concluded:
[We] find that the number of bins indicating possible tidal periodicities is no more than might be expected due to random chance and that there is no clear tidal triggering signal prior to the 2011 Tohoku-Oki earthquake.
Hirose et al. (2022) examined p-value changes over time along the Tonga-Kermadec megathrust. Without commenting on the general validity of the precursory p-value lowering, they determined that the background variation of p-values in that region precludes any practical use of precursory tidalicity to forecast large earthquakes. Of the ten M7+ earthquakes that they evaluated, none of them had a p-value below 5% in the final time bin prior to the earthquake (including for the 1982 earthquake).
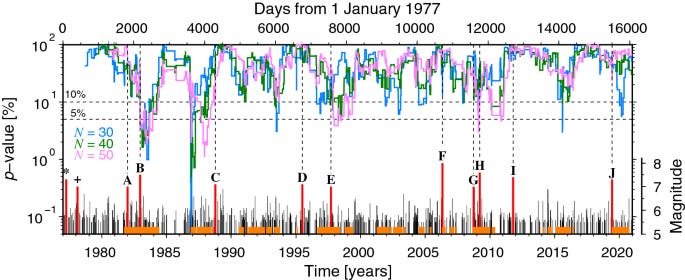
They concluded:
For target earthquakes of magnitude Mw ≥ 7.0, the forecasts were as ineffective as random guessing.
Inspired by Hirose et al. (2022), we plotted up a number of similar timelines for megathrust faults around the world, and we see the same pattern in all of them - p-value variations that don’t seem to correlate with large earthquakes.
So, can tides warn us of upcoming large earthquakes? We don’t think so. If someone wants to propose a new way of looking for this effect, which will surely happen if the past is a guide to the future, we would hope that they look at all available earthquakes and not just one or three.
What does all of this mean for theoretical models of earthquake nucleation? Nothing much, really. It turns out that the models are quite flexible, because they remain somewhat unconstrained by observations. When (if) we arrive at a time when our understanding of fault physics is secure enough that we can make predictions to be tested against observations, rather than relying on carefully curated observations that confirm our biases, then maybe the degree of tidalicity of faults prior to large ruptures will seem more meaningful.
Luckily, there are some observations of profound correlations between tides and some types of fault slip, including actual earthquakes. In the next post, we will take a look at those fascinating results.
Read our other posts analyzing potential earthquake precursors! We make our research analyses permanently free to read. If you think this kind of public-facing science is important, consider supporting our work as a paid subscriber.
References:
Beaucé, E., Poli, P., Waldhauser, F., Holtzman, B. and Scholz, C., 2023. Enhanced tidal sensitivity of seismicity before the 2019 magnitude 7.1 Ridgecrest, California earthquake. Geophysical Research Letters, 50(14), p.e2023GL104375. https://doi.org/10.1029/2023GL104375
Bowman, D.D. and King, G.C., 2001. Accelerating seismicity and stress accumulation before large earthquakes. Geophysical Research Letters, 28(21), pp.4039-4042. https://doi.org/10.1029/2001GL013022
Bradley, K. and Hubbard, J. (2023). Do Earth tides warn of impending large earthquakes? Earthquake Insights. https://doi.org/10.62481/695e5945
Bradley, K., and Hubbard, J., 2024. The great tidal earthquake hypothesis test, part I. Earthquake Insights, https://doi.org/10.62481/9ab803be
Bradley, K., and Hubbard, J., 2024. The great tidal earthquake hypothesis test, part III. Earthquake Insights, https://doi.org/10.62481/3b93879a
Brinkman, B.A., LeBlanc, M., Ben-Zion, Y., Uhl, J.T. and Dahmen, K.A., 2015. Probing failure susceptibilities of earthquake faults using small-quake tidal correlations. Nature communications, 6(1), p.6157. https://doi.org/10.1038/ncomms7157
Chanard, K., Nicolas, A., Hatano, T., Petrelis, F., Latour, S., Vinciguerra, S. and Schubnel, A., 2019. Sensitivity of acoustic emission triggering to small pore pressure cycling perturbations during brittle creep. Geophysical Research Letters, 46(13), pp.7414-7423. https://doi.org/10.1029/2019GL082093
Hardebeck, J.L., Felzer, K.R. and Michael, A.J., 2008. Improved tests reveal that the accelerating moment release hypothesis is statistically insignificant. Journal of Geophysical Research: Solid Earth, 113(B8). https://doi.org/10.1029/2007JB005410
Hirose, F., Maeda, K. and Kamigaichi, O., 2022. Efficiency of earthquake forecast models based on earth tidal correlation with background seismicity along the Tonga–Kermadec trench. Earth, Planets and Space, 74(1), pp.1-11. https://doi.org/10.1186/s40623-021-01564-4
Hubbard, J. and Bradley, K., 2024. The great tidal earthquake hypothesis test, part II. Earthquake Insights, https://doi.org/10.62481/2c56f873
Li, Y. and Chen, L., 2024. Analysis of the seismicity related to the tidal stress prior to the M w7. 8 Kahramanmaras, Türkiye earthquake. Geomatics, Natural Hazards and Risk, 15(1), p.2284118. https://doi.org/10.1080/19475705.2023.2284118
Scholz, C.H., 2019. The mechanics of earthquakes and faulting. Cambridge university press.
Tanaka, S., 2010. Tidal triggering of earthquakes precursory to the recent Sumatra megathrust earthquakes of 26 December 2004 (Mw 9.0), 28 March 2005 (Mw 8.6), and 12 September 2007 (Mw 8.5). Geophysical Research Letters, 37(2). https://doi.org/10.1029/2009gl041581
Tanaka, S., 2012. Tidal triggering of earthquakes prior to the 2011 Tohoku‐Oki earthquake (Mw 9.1). Geophysical research letters, 39(7). https://doi.org/10.1029/2012GL051179
Tanaka, S., Ohtake, M. and Sato, H., 2002b. Spatio‐temporal variation of the tidal triggering effect on earthquake occurrence associated with the 1982 South Tonga earthquake of Mw 7.5. Geophysical Research Letters, 29(16), pp.3-1. https://doi.org/10.1029/2002GL015386
Wang, W., & Shearer, P. (2015). No clear evidence for localized tidal periodicities in earthquakes in the central Japan region. Journal of Geophysical Research: Solid Earth, 120(9), 6317–6328. https://doi.org/10.1002/2015jb011937


Thank you for this invaluable and lucid analysis. You write, "Academic publishing is particularly susceptible to confirmation bias, because no journal wants to waste its valuable (digital) ink reporting negative results." Reporting negative results is an essential and honorable undertaking. I would not blame the journals for its absence, but rather us authors.
Another excellent chapter!