Discover more from Earthquake Insights
Satellite images suggest slip on a steep, north-dipping fault in Morocco
The Tizi n'Test Fault is a famous fault with a long geological history
Read this post in another language using Google Translate. Translations are automatic and have not been validated. If you would like to assist with translating this post to Arabic, Berber, or French, please contact us or leave a comment below.
The first radar-based satellite images of deformation in the Morocco earthquake have been released - revealing how much the land surface moved during the earthquake. Yesterday, we discussed the challenge of determining which of the two faults slipped. Today, we will look at whether the InSAR data really implicate one or the other.
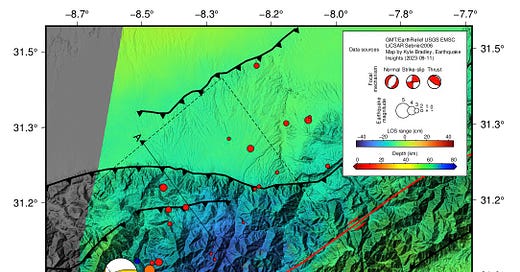
We downloaded the LiCSAR unwrapped interferogram from COMET (original InSAR images are fringy and pretty but displacements can’t be read directly). The plot is certainly intriguing. Because the break between the uplifted (blue) and downthrown (yellow) lobes is not sharp, it appears that the rupture was blind. This presents a challenge in terms of determining which plane slipped. Also, because the amplitude of the displacement field is small and the motions are mostly vertical, sub-pixel correlation is not likely to produce better insights about the fault slip than the InSAR images.

Initial reactions to the InSAR data online indicate a professional preference for rupture of the steep fault. However, we wanted to compare the data with a-priori models to try to keep our own assessment as dispassionate as possible. Luckily, such models have been provided already by Simone Atzori (@SimoneAtzori73) via X (formerly known as Twitter). Note that our only InSAR data thus far is from descending orbits, so the right-hand panels are what we should be looking at. These figures also show the satellite Line of Sight direction, which for today’s interferograms are directed toward the SSW.
If the fault is the steeply dipping plane:

If the fault is the shallowly dipping plane:

The models are quite similar at first glance, because the slip is small and at significant depth (blind). The more far-field your observations are from a double-couple source, the less easy it is to discriminate between the two possible faults; this is a typical issue for interpreting focal mechanisms.
But can we tease out anything, while waiting for geodesists to do their actual modeling? Both hypothetical models show larger magnitude uplift in the north than subsidence in the south, so that doesn’t seem to help. We can see that the models differ in the orientation and density of fringes at the hinge area. The steep fault has denser fringes with a hinge oriented ENE-WSW, compared with the less dense fringes and E-W oriented hinge for the shallow-dipping fault. This difference is due to how close the slip actually gets to the ground surface - for the steep fault, it approaches closer to the surface and therefore the displacement gradient (fringe density) is higher.
The three available fringe interferograms look like this (cut and pasted from the COMET website, so the scale isn’t exactly the same for each image):
Reassuringly, the fringe patterns are quite similar to the a-priori models. But which model is closer to the data? To us, it seems like the hinge-line area is actually more consistent with rupture of the steep fault, based on orientation and fringe density.
As seen in our first figure at the top of the post, the hinge line coincides with a well-known fault with a long geological history: the Tizi n’Test Fault (TNTF). The fault formed under different stress conditions in the deep past (several hundred million years ago), and was active at various times during the formation and breakup of the last great supercontinent, Pangaea. Today, the fault is considered to be “weak,” accommodating shortening despite its unfavorable orientation with respect to the current stress field.

One of the reasons that it has taken so long to identify the fault that slipped in this earthquake is because the locations of the earthquake and its aftershocks do not match any obvious, known fault. There are two possible reasons for this. First, the lack of a dense local network means that earthquake locations must be inverted primarily on the basis of far-field data. Basically, this means that if you know how fast seismic waves travel through the crust, you can tell how far away the earthquake was based on the time it took for the waves to reach the station. With enough stations, it is possible to pinpoint the 3D location.
However, this is complicated by the fact that seismic waves speeds are not the same everywhere - they vary both laterally and with depth. Without an accurate 3D velocity model, it is not possible to accurately locate earthquake events. It is likely that this contributed to uncertainties in earthquake locations.
Second, aftershocks do not always occur on the fault that slipped in the mainshock. Aftershocks are simply earthquakes that are caused by stress changes due to a mainshock event. Other faults and fractures around the TNTF were subjected to stress changes due to the earthquake, and appear to have slipped in response. It does appear that most of the aftershocks have occurred around the area of slip, although they do extend farther northeast than we might expect.
Most of the aftershocks are located within the hanging wall of the mainshock - the body of rock above the fault. Typically the hanging wall of a thrust fault experiences more deformation than the footwall, because it can move up into the air - the footwall cannot as easily subside, because there is rock below. This effect has been seen many times, in areas where accurate earthquake relocation was possible:

So, it seems like the least-expected fault to rupture in the region - the Tizi n’Test Fault - has probably ruptured. Why do we say least expected? Some previous studies have not inferred that this fault is active (e.g. Sebrier et al., 2006). This is probably because we rely on geomorphology as the primary record of activity for such slow-moving faults, and steep intramontane faults do not always leave a clear geomorphic imprint of activity. In comparison, frontal thrust faults like to lift up terraces that we can easily map.
Over time, actual analyses will be done on these data by specialist research groups, and we look forward to reading those results. If the conclusion holds that the Tizi n’Test Fault hosted the rupture, then it clearly shows that the High Atlas range is a site of active slip partitioning, where the convergence across the orogen is distributed onto multiple active faults with different slip senses. This is consistent with most of the prior tectonic interpretations of the High Atlas as an active transpressional orogen.
References
Fekkak, A., Ouanaimi, H., Michard, A., Soulaimani, A., Ettachfini, E.M., Berrada, I., El Arabi, H., Lagnaoui, A. and Saddiqi, O., 2018. Thick-skinned tectonics in a Late Cretaceous-Neogene intracontinental belt (High Atlas Mountains, Morocco): The flat-ramp fault control on basement shortening and cover folding. Journal of African Earth Sciences, 140, pp.169-188, https://doi.org/10.1016/j.jafrearsci.2018.01.008
Huang, Y., Wu, J., Zhang, T. et al. Relocation of the M8.0 Wenchuan earthquake and its aftershock sequence. Sci. China Ser. D-Earth Sci. 51, 1703–1711 (2008). https://link.springer.com/article/10.1007/s11430-008-0135-z
Sébrier, M., Siame, L., Zouine, EM, Winter, T., Missenard, Y. and Leturmy, P., 2006. Active tectonics in the Moroccan high atlas. Sébrier, M., Siame, L., Zouine, E.M., Winter, T., Missenard, Y. and Leturmy, P., 2006. Active tectonics in the moroccan high atlas. Comptes Rendus Geoscience Comptes Rendus Geoscience, , 338 338(1-2), pp.65-79. (1-2), pp.65-79. https://doi.org/10.1016/j.crte.2005.12.001https://doi.org/10.1016/j.crte.2005.12.001
InSAR data: https://comet.nerc.ac.uk/comet-lics-portal-earthquake-event/
Satellite images suggest slip on a steep, north-dipping fault in Morocco
Thank you for these articles! I have no expertise in seismology, but have a personal interest in Morocco, and it is interesting to read about the scientific process in understanding the earthquake. Based on what we know so far, could you estimate the risk of further substantial earthquakes in the area surrounding Marrakesh, over the upcoming weeks/months? Would you think the risk over the upcoming weeks/months is substantially higher than the baseline risk?
Thank you for this article that emphasizes a highly tectonically active fault. Please refer to our studies below, which explain the reactivation of this faults system:
https://doi.org/10.1016/j.geomorph.2011.07.010
https://doi.org/10.1016/j.geomorph.2010.01.006
https://doi.org/10.1007/s12517-021-07126-y