
More machine learning earthquake predictions make it into print
We predict that the methods won't hold up... Let's find out!


Citation: Bradley, K., Hubbard, J., 2024. More machine learning earthquake predictions make it into print. Earthquake Insights, https://doi.org/10.62481/bd134329
We examine recent claims of effective earthquake prediction schemes that use machine learning on big data to predict earthquakes in parts of China. These particular schemes represent winners, or at least high performers, of the AETA earthquake prediction competition, and are published in recent papers — including a study in the highly reputable BSSA journal.
We find that the reported prediction accuracies for the winning models are exactly what we would expect if each team was just flipping a fair coin. Thus, this earthquake prediction scheme seems to be another example of dressing up expected failure as unexpected success.
Like all scientific paper analyses, this post will always remain free to read and open to comment.
Earthquake Insights is an ad-free newsletter written by two earthquake scientists. Our posts are written for a general audience, with some advanced science thrown in! To get these posts delivered by email, become a free subscriber. If you would like to support our work here, please also consider a paid subscription.
In September, we examined a Nature Communications paper that claimed to be able to predict upcoming large earthquakes in Alaska and California using a machine learning method applied to earthquake catalogs. We found that the method, unsurprisingly, does not work.
In this post, we examine several more papers about earthquake prediction that use machine learning. These are but a part of a veritable flood (tsunami?) of similar papers that are riding the wave of machine learning. OK, enough with the liquid metaphors, let’s get on with it.
The most prominent paper was written by Omar M. Saad and coauthors. This paper was published in December 2023, and is titled: “Earthquake Forecasting Using Big Data and Artificial Intelligence: A 30-Week Real-Time Case Study in China.” The manuscript appeared in the Bulletin of the Seismological Society of America (BSSA), a storied seismology journal that has published some of the most influential earthquake-related papers over its more than a century of existence. Following publication, the results were highlighted by Smithsonian Magazine and other news outlets.

Saad et al. present a trained machine learning model that won an earthquake prediction competition. Over 30 consecutive weeks, they predicted whether or not a M3.5+ earthquake would occur in a specific region of western China during the following week. With a claimed prediction accuracy of 70%, the team of Saad et al. won first place out of (they say) 617 teams.
Before we start, we have to note that earthquake forecasting is the production of a probability estimate covering a range of potential future earthquakes over a range of time, while earthquake prediction is the prognostication of a specific future event. Forecasting has proved to be useful if a bit boring, while predictions have constantly failed to work over centuries, but are more exciting.
How can you tell which is which? Our rule of thumb is simple: does the occurrence or non-occurrence of a specific earthquake matter? If so, a prediction was made.
Many of those who try to predict earthquakes have by now learned to incorrectly use the word forecast instead of predict in paper titles and abstracts, even if they still make only predictions, and even use the word “predict” in the manuscript text. This is presumably an evolutionary response to automatic rejection of prediction papers.
Saad et al. (2023) is actually just one of three recent papers that showcase the results of this earthquake prediction competition, which ran for three years (2020-2022). The competitions were organized by AETA (Acoustic Electromagnetic to AI), an earthquake prediction research project based out of Peking University in China. The other two papers are published in Applied Sciences:

and Frontiers in Earth Science:

Wang et al. and Xie et al. are bold enough to use the correct word, prediction, in their title. We note that two authors show up on all three author lists: Shanshan Yong and Xin’an Wang. These authors are actually the founders and directors of AETA.
The basic idea of AETA is that earthquake prediction might become possible if enough sensors are deployed around a seismically active region, recording sound vibrations and electromagnetic fields at all times. AETA has, in fact, deployed many such sensors across various parts of China, which have recorded data for some years now.

Using “big data” and “AI,” AETA claims that they can predict upcoming earthquakes with enough accuracy to be practically useful. Their public statements are pretty unequivocal.
From the official AETA white paper:

Pretty impressive stuff. From Facebook posts:

AETA’s main claim to fame seems to be the successful “prediction” of two M5+ earthquakes in China:
Once again, it is important to note that the term “forecast” is being used incorrectly in these communications.
To build confidence in their method, AETA designed and administered three earthquake prediction competitions, in 2020, 2021, and 2022. They provided years of AETA training data to each team, which were used to develop earthquake prediction models using various machine learning/AI techniques. After these models were trained, they were applied to live data. Each week during the competition period, the teams received newly collected AETA data, which they used to make a prediction: would at least one magnitude 3.5+ earthquake would occur within 100 kilometers of any AETA station, during the upcoming week? If so, where, and what magnitude? (Note that a prediction did not have to specify which AETA station the earthquake would occur near to be successful — any earthquake within the region of interest, which spanned >800 km, was still considered a match.)
The relative success of the teams was calculated using a highly complex formula that took into account predicted locations and magnitudes as well as the yes-or-no guess. Unfortunately, the precise grading algorithm was never exactly revealed, and it is unclear why any team may have actually scored higher or lower. Fortunately, the published papers only rely on claims of prediction accuracy, and not the actual performance in the contest.
Each year, the top team was awarded a significant cash prize, with cash prizes for other top finishers as well.
On the face of it, a competition using locked-in methods applied to live data does seem like the best way to determine whether an earthquake prediction method actually works. However, there are also some major pitfalls for the unwary.
Our plan for understanding these results
Our paper analyses usually dive into the details of a published method, so that we can understand exactly how the pieces of the puzzle fit together. We usually try to replicate figures directly, and then make adjustments to test the robustness of the method. This time, however, the methods of all three papers are extremely complex machine learning algorithms that translate a huge amount of (potentially meaningless) instrumental data into simple earthquake predictions. Digging into these studies is a monumental task, and we can’t ask our readers, or ourselves, to wade through that.
Fortunately, we don’t need to worry about the actual details of these methods — we only need to check how well the methods actually seem to work, using the claimed success rates.
So, our approach will be to compile information about the success rates of the various models, and then compare them to predictions that use exactly no additional information: random guesses. Using only the locations and times of prior earthquakes to understand where and how often earthquakes occur in the competition region, we will make random weekly guesses. If the best results from the competitions, which are theoretically based on vast amounts of real-time data collected by specialized instruments, do not even outperform the best outcomes from random guessing by a similar number of teams, then clearly we can safely ignore all claims of revolutionary earthquake prediction.
Unfortunately, we could not find any official statistics or final results from the AETA competitions. The competition websites have largely disappeared, and the AETA website contains little useful information. The published papers also do not reveal any information on the actual competition results.
Thus, we had to rely on the partial data from the three published papers, social media posts, Chinese language computer science bulletin board posts, and public Github archives from a few contestants. We compiled reports on the number of contestants, the number of teams, and the contest parameters for each year. We also compiled statements about the accuracy of the “best-performing” models, shown in the figure below:

It looks like the best results top out at about 70% prediction accuracy.
The meaning of accuracy
What does it mean for an earthquake prediction scheme to be accurate? It depends on how the prediction is made.
If we are allowed to only make predictions every now and then, when we feel like it, our accuracy can only be determined by whether each predicted earthquake does or does not happen. This means that only the true positives (TP; an earthquake was predicted, and one happened) and false positives (FP; an earthquake was predicted, but none happened) matter. Our accuracy can be calculated as:
If we are forced to make regular predictions over equal time intervals (as in the AETA competition), then we also have to predict when earthquakes will not occur. If our no-earthquake prediction is correct (true negative; TN), we are more accurate. If we predict that no earthquake will occur, and an earthquake does actually happen (false negative, FN), we are less accurate. The accuracy is calculated as:
This is how accuracy is calculated in the AETA competition.
The next step is to figure out what kind of accuracy counts as “good.” Here is a Facebook post from AETA:
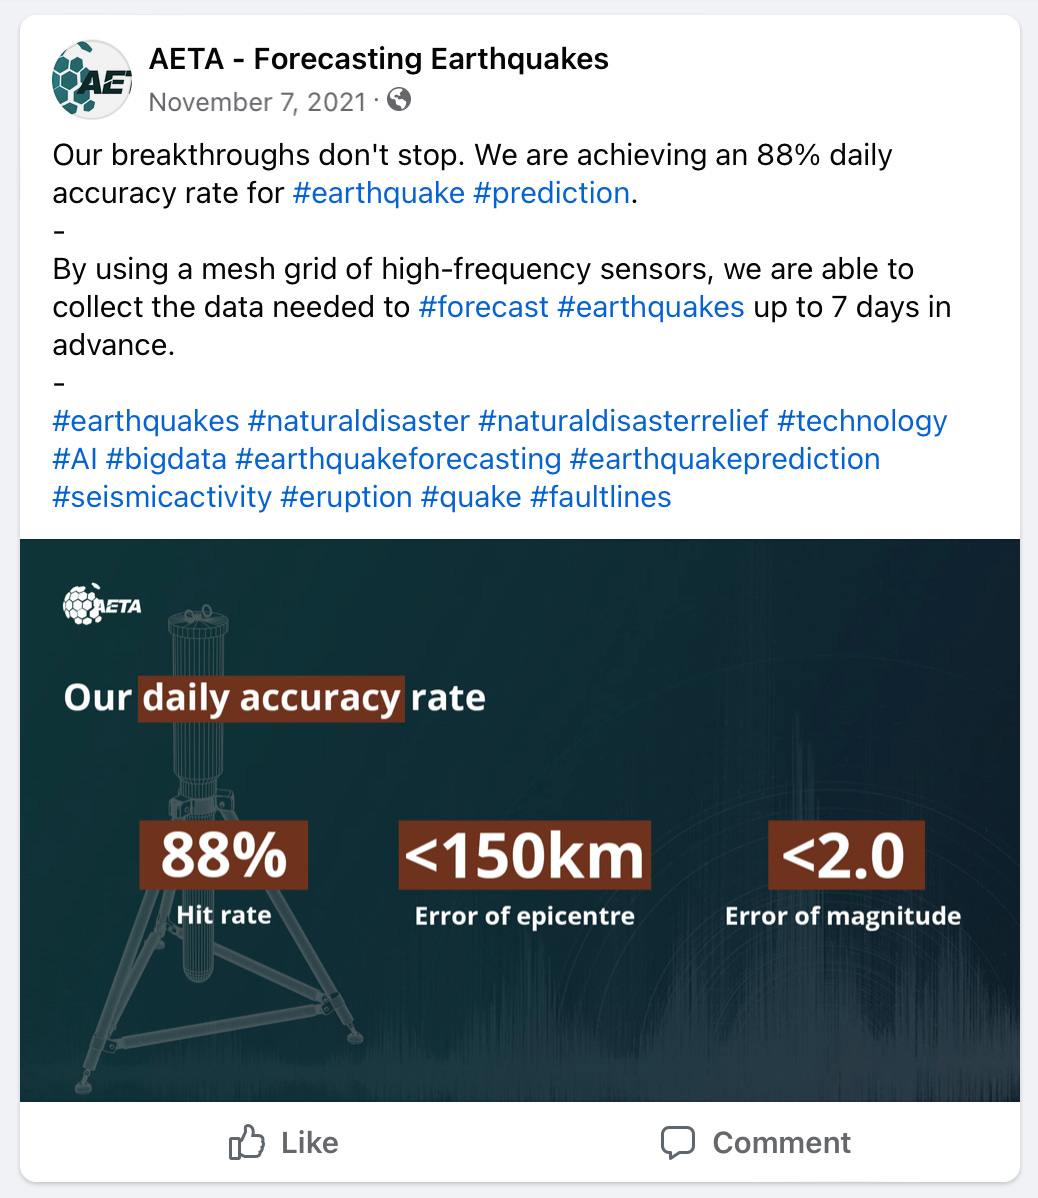
Is an 88% daily accuracy rate actually impressive, or not? It sounds impressive.
Here’s the thing: the accuracy you can expect from guessing depends on the region you target, and the magnitude range you have chosen. For instance, if you were making predictions about whether a M7+ earthquake were going to occur in New York City on any given day, you could expect to achieve 100% accuracy by simply guessing no for each day. On the flip side, if you were predicting whether a M0+ earthquake were going to occur in California on a given day, you could get a similarly high accuracy by guessing yes each time. In both cases, the accuracy would be very high — but also completely unimpressive. And, in either case, your accuracy would drop to about 50% if instead you flipped a fair coin each time.
So, how does the AETA reported daily accuracy of 88% stack up? To figure this out, we had to look at the history of earthquakes in the target area, and determine the proportion of days that have earthquakes. We downloaded the earthquake catalog from the Chinese National Earthquake Data Center, covering the region from 98°E to 107°E longitude and 22°N to 34°N latitude. We selected only earthquakes with magnitude 3.5 or greater, which were also located within 100km of an AETA station. This is the same catalog used to train the AETA models.
For a catalog spanning January 1, 2010 to September 23, 2024, there are 510 unique days where at least one M3.5+ earthquake occurred within the target area (within 100km of an AETA station, in the contest area). There are 5378 days in that time range. So if we predict “no M3.5+ earthquake” for each upcoming day, over almost 15 years we will achieve a daily prediction accuracy of:
Over the long term, continuous negative predictions appear to outperform the accuracy touted by AETA.
Looking at only the 2021 competition period, our catalog has 19 days with at least one M3.5+ earthquake, out of 150 competition days. Guessing no each day would have yielded an accuracy of 87.3% — quite close to the 88% for the same period claimed by AETA. So no, that prediction accuracy is not impressive at all.
This is a major problem with using prediction accuracy as a metric of success: since it is highly sensitive to the actual ratio of yes and no periods, it doesn’t carry any intrinsic meaning without some kind of baseline for comparison. If earthquakes are so common that every time window has many events, then it is easy to achieve 99%+ accuracy: always guess that an earthquake will occur during each time window. If earthquakes are extremely rare, then we can also achieve 99%+ accuracy by guessing that an earthquake will not occur each day. In fact, if the natural occurrence rate is not exactly 50%/50%, then the most reliable way to achieve a high accuracy is simply to always guess yes or no.
For a competition, we want to be able to discriminate between different models using accuracy as a metric for success. So, it would be nice if the long-term rate of occurrence of earthquake vs. non-earthquake time windows was about 50/50. Fortunately, this is easy to achieve, because we can tweak two parameters. By lowering (or raising) the minimum magnitude of qualifying earthquakes, we can make time windows with earthquakes more common (or less common). By changing the length of the prediction window (one day, or one week), we can also directly change the average occurrence rate. So, for a given region, the natural seismicity rate can be turned into a nice 50/50 ratio without too much trouble, by choosing an appropriate time window and magnitude range. And conveniently, this is the ratio that shows up in the AETA competition weekly time windows.
How to boost apparent accuracy: choose “the best” result retroactively
The structure of the AETA contest was to predict whether an earthquake would or would not occur in a specified region, over each successive 7 day period.
So, how did some teams outperform the expected ~50% accuracy rate — achieving 62.5%, 70%, or even >70% accuracy? Were those teams actually were gaining some critical information from the input data, and do they have special insight into upcoming earthquakes, as claimed by AETA?
That is one possibility. Another possibility is that this is simply random variation: for any short-term series of guesses, we can expect to see some range of outcomes based only on luck. How unusual would it be to achieve these higher accuracies?
Because earthquakes occur on average in ~50% of weeks in the competition area, we can treat yes-or-no guesses as coin flips. Fortunately, mathematicians long ago figured out the statistics of coin flips, so we can lean on their results — specifically, using the binomial distribution to estimate our chances of getting at least N guesses right out of M trials. The method also works if the coin isn’t fair, but we luckily don’t have to worry about that in this case.
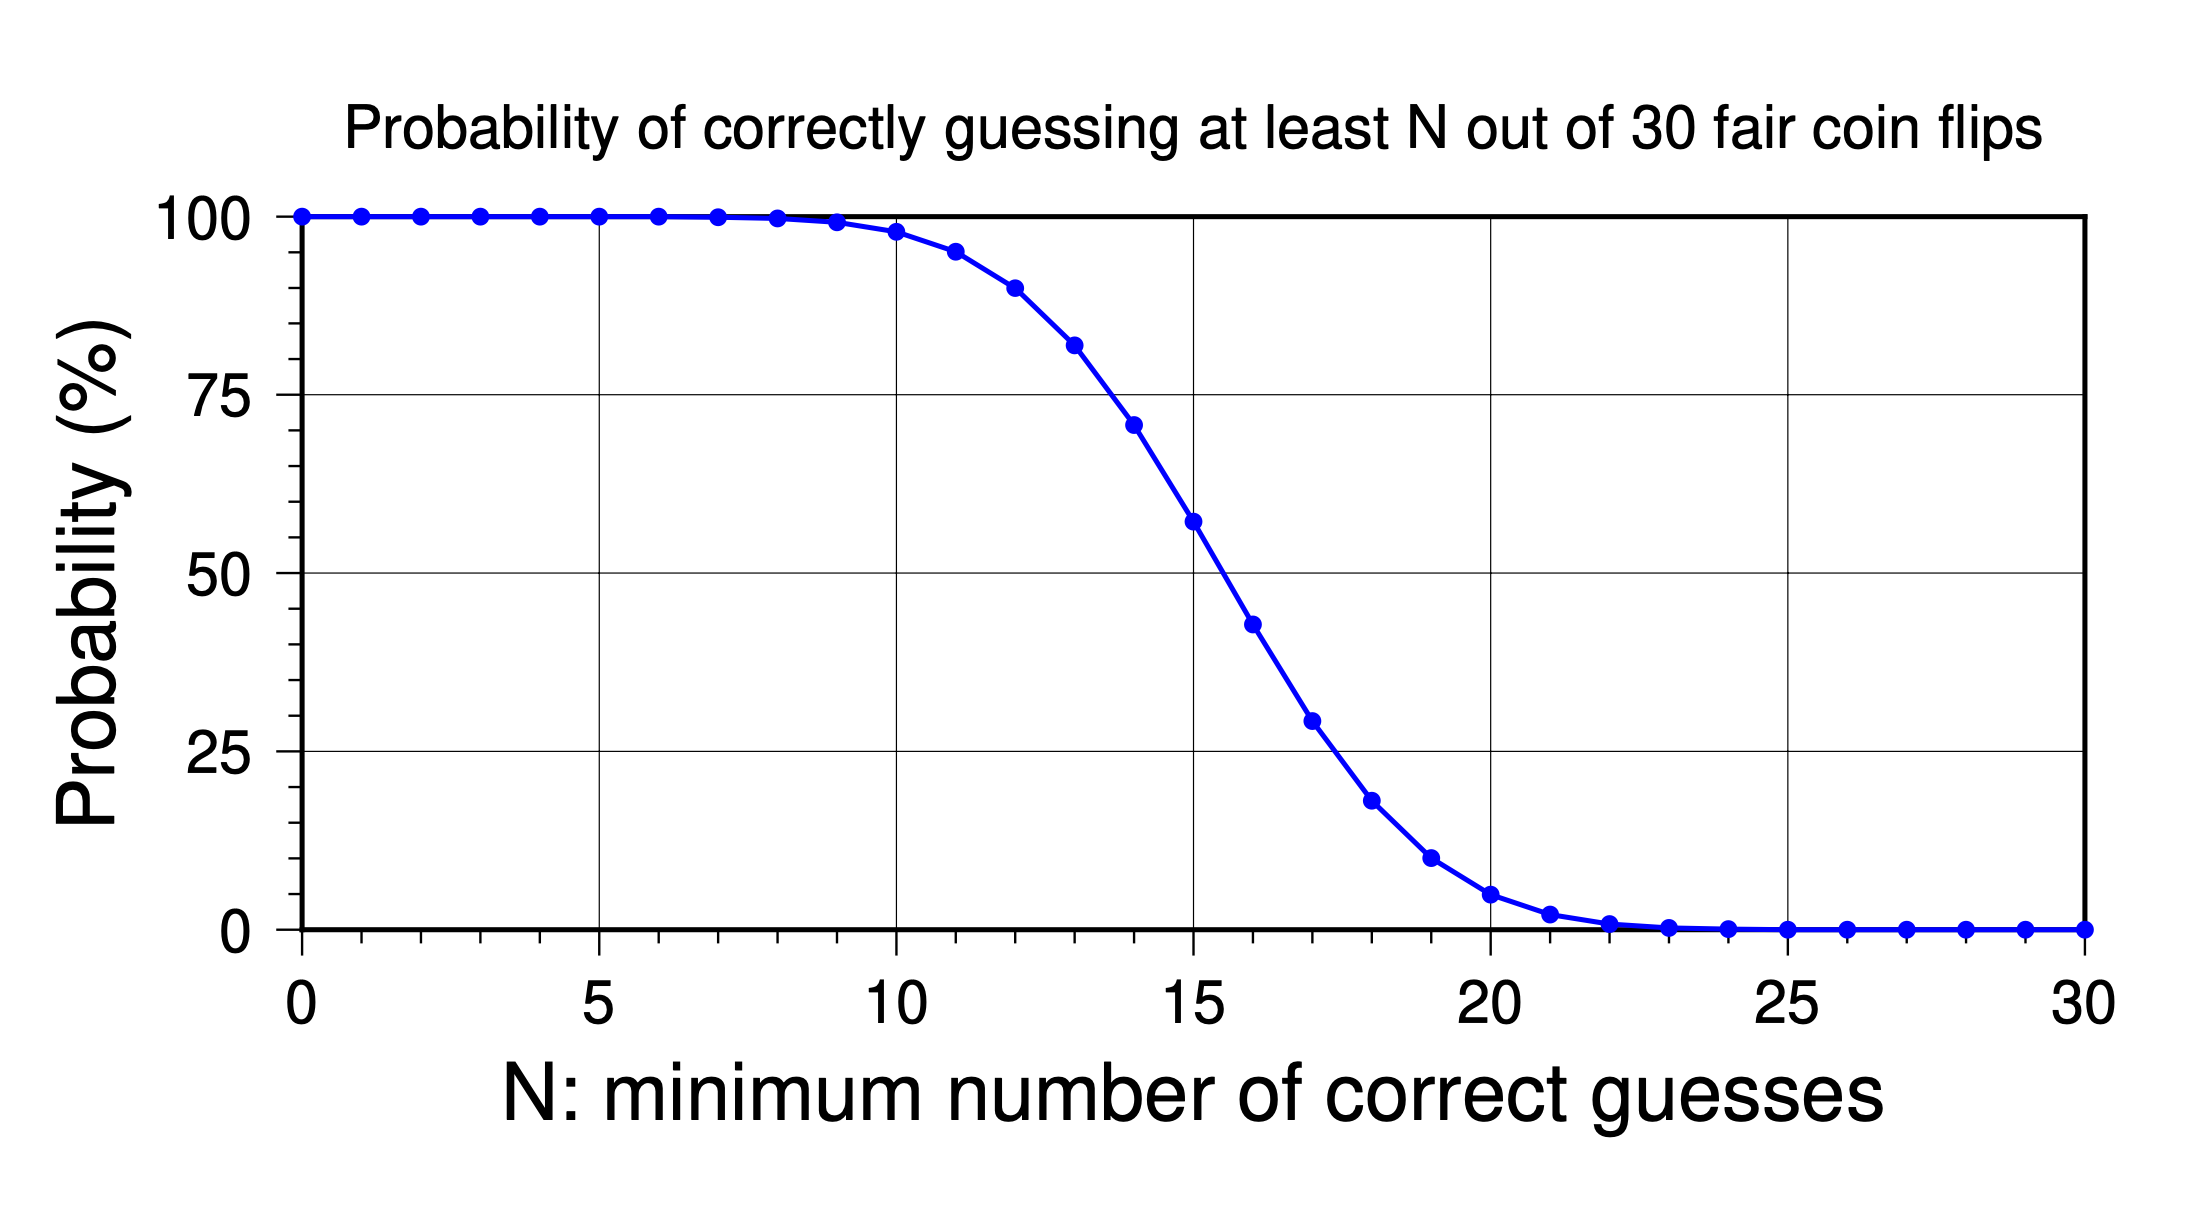
The graph below shows how likely it is to correctly guess at least N out of 30 coin flips. (The AETA competitions were 16, 30, and 26 weeks long, in 2020, 2021, and 2022, respectively.) The probability of correctly guessing 21 or more out of 30 weeks — like Saad et al. (2023) — is about 2.1%. That would yield an accuracy of 21/30, or 70%. So, each competitor in the 2021 competition had a ~2.1% chance of achieving an accuracy of at least 70%, if their guessing was actually random.
So, one way to think about the 70% accuracy touted by Saad et al. (2023) is that it is unusual: they had only a 2.1% chance of achieving it randomly. Of course, that is true for each team in the competition: each one had a 2.1% chance of randomly reaching 70% accuracy.
If we have multiple teams competing (let’s call the number of teams T), then each team gets an independent chance. Let’s consider how likely it is that at least one team will achieve an accuracy of 70%.
For each individual team guessing 30 times, the probability of achieving at least 70% accuracy is 2.1%. So the probability that each individual team won’t achieve this accuracy is 97.9%. Because the guesses are independent between the teams, we can simply multiply that probability by itself T times to calculate the probability that no team will achieve this accuracy. Then, subtract this result from 1 to negate that — i.e., to calculate the chance that at least one team will achieve this probability.
More generally, if the probability of a specific team achieving a specific accuracy is P (P goes from 0 to 1, not 0% to 100%), then the overall probability of T teams achieving that accuracy (at least once) is:
The more teams there are in the competition, the more likely it becomes that one of them will achieve a high accuracy. The following graph shows some examples.
When only a few teams compete (T=6; red curve), it is still pretty unlikely that even one team will correctly guess at least 21 fair coin flips (p=12.2%). But if 60 teams compete (green curve), then p=72.7% — there is a better than average chance that at least one team will succeed. And if 600 teams compete (blue curve), it is almost guaranteed that at least one will get at least 21/30 guesses correct by flipping a coin: 99.9998%. (Recall that Saad et al. claimed to perform the best out of 617 teams, and was successful in 21 out of 30 weeks.) As we add more teams, the best-performing team gets better, but not that much better. If 6000 teams compete (purple curve), then there is a greater than 50% chance that at least one team will achieve an accuracy of 25/30 (83.3%), but the chance of ≥27 successes is quite low.

In other words, the more teams were involved in the AETA competitions, the more likely it is that some team might reach a high accuracy simply by random chance. Since it is only the winning models that are likely to be published, their accuracies have to be compared against what would be expected from random chance, given the number of competing teams. In fact, this analysis already shows that the accuracies of the winning AETA models are nothing to write home about. (And nothing to write to a journal about, either.)
Simulating the AETA competitions using random guessing
Theory is great, but it’s always best to see how things work out in practice. So, we simulated the competition process — creating our own teams, and challenging them to (retroactively) predict the results from the competition weeks. In contrast to the AETA contest, however, we used only random guessing to make weekly predictions.
The natural rate of past earthquakes is an important factor for predicting future events, especially when a competition demands predictions for a period of time like a week. To find the correct weight for our flipping coin, we calculated the number of earthquake and non-earthquake weeks over a long period prior to the competition periods. It turns out that this number is about 48% — pretty close to the 50/50 fair coin flip!
For each contest period, we use our slightly unfair coin to generate weekly random guesses about whether the following week will see an earthquake or not.
The published papers also describe a “mean distance error” metric. This is basically how far off, distance-wise and on average, each prediction was from the actual earthquake location. To replicate that, whenever we predict an earthquake, we select at random another earthquake within the training catalog, and use its location to calculate our distance error. If multiple earthquakes occurred, we simply choose the one closest to our guess. At the end of each test period, we calculate the mean of these distance errors. Other approaches could also work, like picking a random location in the contest region.
To mimic the multiple teams in the competition, we create many random earthquake guessers, using a different seed for our random number generator each time.
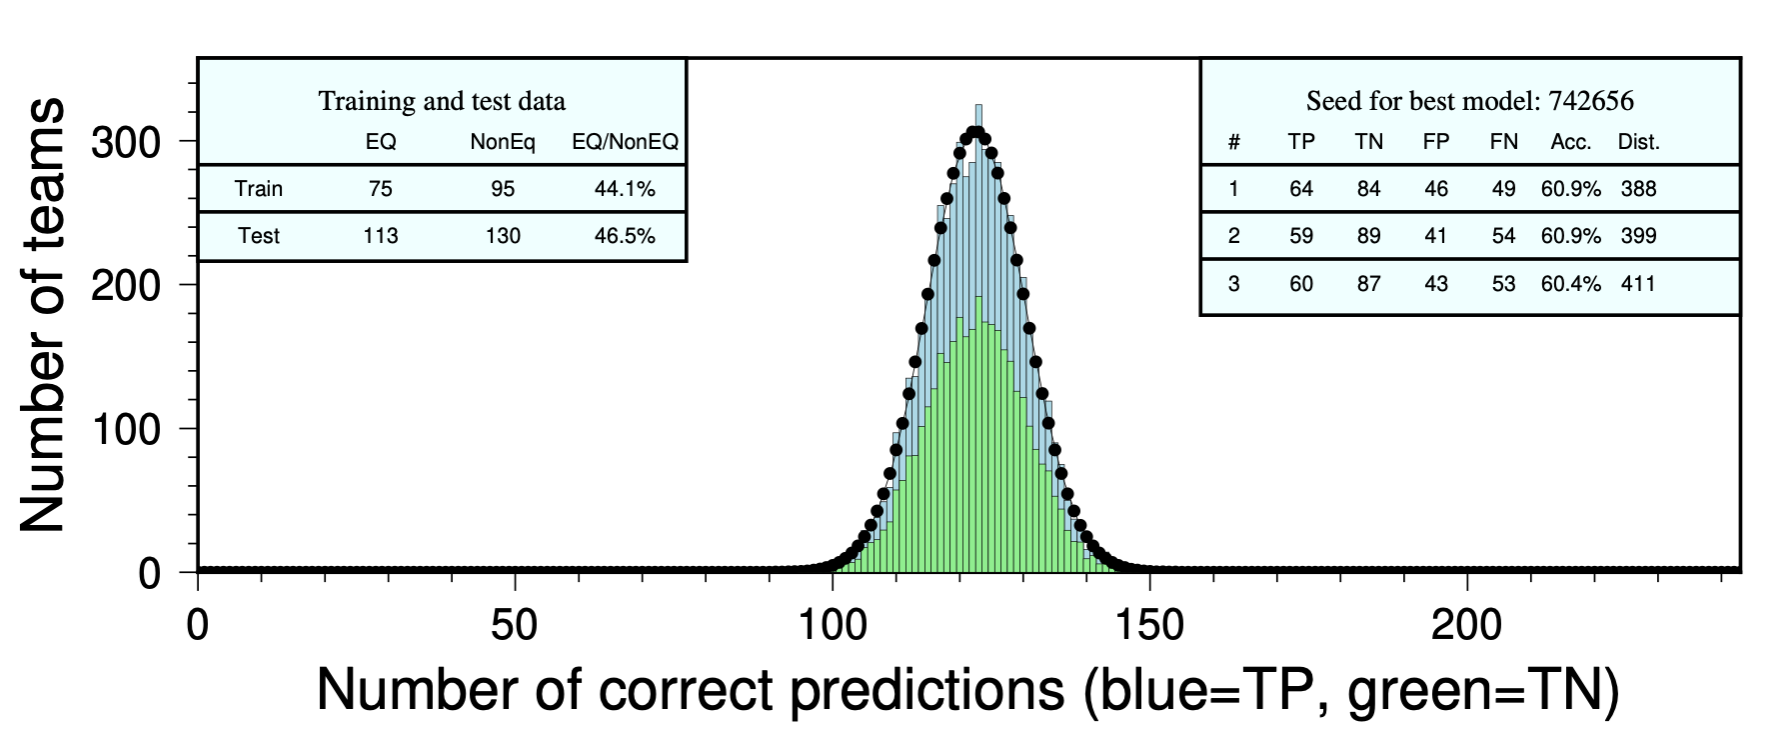
The results are shown as histograms below. Each bin centered on a number N contains the number of “teams” that got N predictions correct. Each bin is also split into two colors: blue on top, and green on bottom. The blue areas represent the proportion of true positives (an earthquake predicted, and at least one did occur), and the green areas are the proportion of true negatives (no earthquake was predicted, and none occurred). The best-fitting normal distributions of the histogram data are shown as thin black curves. We can also calculate the theoretical probabilities of making certain numbers of correct predictions — those are shown as black dots, one per bin. For the smaller competitions, the black dots don’t always align well with the thin black curve, while for larger competitions they match pretty well — as expected.
Because we care about the specific AETA competition results, we ran our random guessers for the actual contest periods, with either 6, 60, 600, or 6000 teams.

How did we come up with the theoretical values (the black dots)? Each week, there is a probability of making a correct positive guess (depending on the rate of positives in the test and training data), or a correct negative guess (depending on the rate of negatives in the test and training data). We summed these probabilities to calculate the probability of guessing correctly each week.
We use the binomial distribution once again to calculate the expected number of correct earthquake predictions using a probability of Pweekly instead of our previous 50/50 guess. Note that this number can only be calculated after the test period is over — since we need to know the real rate of positives and negatives during the test period.
At the end, we identified the three teams that performed best, based first on accuracy and second on the mean distance error. These are our gold, silver, and bronze medalists. We include the results from these three teams in a panel at upper right of each histogram. Among the various top performers, the mean distance errors range from 254 to 600 km. While these might seem to be very high numbers, they are similar to the results of Saad et al., who had a mean distance error of 381 km.
We keep track of the best-performing random seed number (the gold medal winner), so we can (1) add ourselves as coauthors and submit the method to a top seismology journal, and (2) apply that model in further tests later — after all, it won a gold medal in our competition, so shouldn’t it work well on future data…?
If the charts above were a bit too much to take, and you didn’t spend much time looking at them, that’s OK. Here are the main takeaways:
When there are only a few teams, the distribution of the results often does not match the binomial distribution; the results are under-sampled.
As we include more teams, the accuracy of the top-performing results increases significantly. This is because the rare random models that more closely match the actual earthquakes are more likely to be discovered. (Of course, the accuracy of the worst-performing teams also decreases, but fortunately, those results can be discarded.)
It doesn’t matter what the actual distribution of earthquake weeks and non-earthquake weeks is over the test period, as long as the training period has about equal occurrence/non-occurrence rates. We see similar distributions for the 2020 event, when most weeks were earthquake weeks, as for the 2022 event, when most weeks were not. This is because we count both positive predictions (when an earthquake was predicted, and did) and negative predictions (when an earthquake wasn’t predicted, and didn’t).
An accuracy rate of 70-80% is completely unexceptional for the top-performing teams, when there are a lot of participants. When few teams are competing (N=6), the maximum accuracy is more likely to be lower, ~60-70%. When there are fewer test weeks, it is easier to achieve a higher maximum accuracy.
It is not uncommon for the mean distance error to fall below 300 km, for at least one of the top-performing models.
Running the best-performing model on new data
Our winning model should be extra-great at predicting new data, right?
Wrong!
We selected our best-performing model from the 2021 competition (seed = 988537) and ran it against the entire earthquake catalog. This is basically running a very large number of AETA competitions. We still use a 30 week competition, but we shift the competition window by 1 day each time, collecting all of the results along the way. The histogram of results from this looks pretty familiar:

Unsurprisingly, our previously best-performing model for the 2021 test period only has an average accuracy of 50% over all possible contest windows. The actual best-performing test period for this model is January 8, 2023 to August 6, 2023 with an accuracy of 73.3% and a mean distance error of 373 kilometers.
Below, we plot the running accuracy of this model over time. Interestingly, the accuracy drops below 20% in early 2022. During that period, simply negating the model prediction would have yielded an accuracy over 80%!
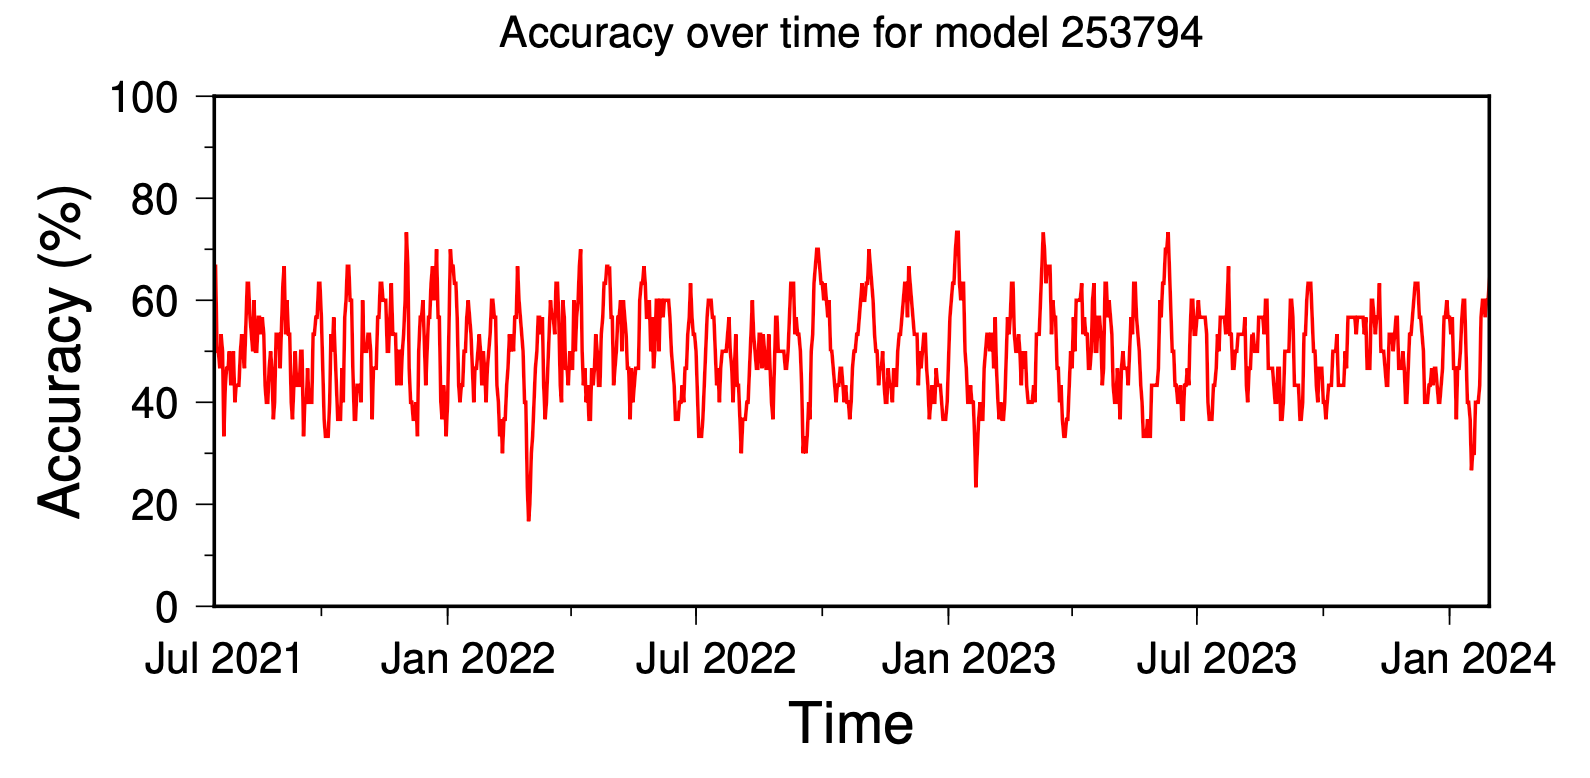
This is exactly the behavior that we expect from a random earthquake predictor. The past performance on one subset of data (the competition period) simply does not tell us about how the model will perform on future data. Only an ensemble of results can reveal the poor utility of the random guessing method.
The published accuracies for the top performing models in the AETA competitions range between ~20% to ~75%. A screenshot of the presumably final leaderboard for the 2022 AETA competition, found at https://github.com/IvanaXu/iAETA, indicates that the top 12 models of that year had a mean accuracy of 46.6%. The lowest accuracy model (coincidentally belonging to IvanaXu), was 29%, while the highest accuracy was only 60%. It is important to note that a model achieving very low accuracy — say 10% — is actually a very good model, because simply negating the prediction would achieve a 90% accuracy.
This range is indistinguishable from the results of random guessing with a relatively low number of participating teams (closer to 60 than to 600). If the stated number of competing teams is closer to 600 (as suggested by AETA and the published papers), then the teams significantly underperform random guessing, in terms of accuracy.
Finally, what if the contest period was much longer? We ran a single contest that lasted 243 weeks, starting from January 1, 2020. Even with 6000 coin-flipping teams, the maximum achieved accuracy is only 60.9%. It’s really hard to be right more than 60% of the time when you’re just guessing in the dark. We suspect that an AETA competition running for 100+ weeks would produce best-performing models with a similarly lower accuracy.
A quick note about the results of Wang et al. (2022)
Wang et al. reported a prediction accuracy of 62.5% from a model that participated in the 2021 competition — the same competition as the Saad et al (2023) paper. We note that there were 30 weeks in the 2021 competition, but Wang et al. only report the results from the first 16 weeks. When we look at the distribution of earthquake vs non-earthquake weeks, we can see something interesting. The bold/italic entries are from the competition period after Wang et al. stop reporting their predictions:

10 out of 13 of those extra weeks are non-earthquake weeks. It seems likely (at least to us) that the accuracy of the Wang et al. (2022) model decreased halfway through the competition, when weeks started not to include earthquakes. Of course, that is just our own interpretation — no explanation for the truncated reporting period is given in Wang et al. (2022). We do not have access to any final report for the competition, to see how the model performed over the full contest period. However, it is important to remember that the organizers of AETA are coauthors on both papers, and would certainly be privy to that information. If a more reasonable explanation exists, we would be interested to hear it.
Some takeaways
Our theoretical calculations and direct simulations clearly show that the published machine learning models of AETA contest winners (with three papers now in print) never exceeded the expected results from simple random guessing, in terms of accuracy, magnitude error, or mean distance error.
This is exactly what we would expect if the input data to the machine learning algorithms has absolutely no predictive power. Indeed, there is no reason to believe that the data collected by AETA are related to earthquake occurrence at all. This is obvious from the fact that the actual data are never actually examined in any of the papers, and no explanation for the physical effect allowing prediction is ever proposed. It also would explain why earthquakes occurred, on average, several hundred kilometers away from their predicted locations.
The contest organizers and participants seem to have little actual experience with earthquake science. For example, a Key Point at the beginning of Saad et al. (2023) is:
We develop a data-driven model for predicting destructive natural earthquakes (magnitude 3.5). - Saad et al., 2023
Magnitude 3.5 earthquakes are not destructive. Even the largest events predicted by Saad et al. (2023), which are M4.5, are not generally destructive in China. Because the research papers do not discuss earthquake histories, earthquake impacts, or earthquakes at all really, it isn’t clear whether any of the coauthors actually understand the actual scope of their work. This is a bad situation where publication apparently precedes actual understanding.
We also note that in 2021 a potentially destructive magnitude 6.4 earthquake actually did strike within the contest area, during the contest period (week 7). To our knowledge, this significant earthquake was not predicted by any team, out of the reported hundreds of teams. Nevertheless, both Wang et al. and Saad et al. claim success that week. In fact, Wang et al. predicted a M3.9 earthquake 570 km away, while Saad et al. predicted a M4.0 earthquake 860 km away. Saad et al. actually match their prediction up not with the M6.4 event, but with a M4.5 aftershock of the larger event, to achieve a lower magnitude error. (Because teams were penalized for mis-estimating the magnitude of events, they always tended to predict M3.9-M4.5 events, which are far more likely than M6+ events, and in any case larger earthquakes tend to also trigger smaller ones that make for more predictable matches.)
To us, the AETA competition seems designed to exploit the work of the contestants to support the interests of the organizers. The claims of prediction capability from AETA, including in the papers that bear the organizers as coauthors, are unconvincing to us and seem disingenuous at best. That this situation resulted in a publication in BSSA (attended by significant media coverage - we are still seeing the stories pop up in our Google News feeds…) is pretty unfortunate, in our opinion. That the AETA method continues to be promoted in other venues is also pretty annoying.
As machine learning hacks-and-slashes its way into every branch of science, we collectively face a huge practical problem. Black-box models that can predict some test data do not generally come with any guarantee of future performance. These models might be secretly (or accidentally) selected from a much larger suite of possible models. Only continued model performance on further data — arising after the paper submission — can prove that a model really does (or does not) work. That is why most scientific results are actually distributed in the form of a proposed physical law or rule, which can be widely tested on new and varied data.
If a black-box model is ever made that really does predict earthquakes with significant skill, we hope that the resulting paper will actually focus on identifying why the model works. Once we understand that, then a black-box model would presumably not be needed anymore. In the meantime, research papers that simply propose a black-box prediction method, without an accompanying physical law that could be independently tested in other ways, should be viewed with great suspicion or just ignored.
This is not a new issue. Following the (ultimately unsuccessful) scientific earthquake prediction frenzy of the 1970’s and 1980’s, some criteria were established to help separate potentially valuable contributions from junk science, psuedo-science, and outright fraud. The (apparently now disbanded) International Association of Seismology and Physics of the Earth’s Interior (IASPEI) Subcommission on Earthquake Prediction adopted the following guideline, among many others (copied here from Geller, 1997 - a great read about the history of scientific earthquake prediction):
(1) The observed anomaly should have a relation to stress, strain or some mechanism leading to earthquakes.
The idea is that there should be a reason why some observations are to been seen as earthquake predictions. For example, the alignment of planets with constellations has no clear physical connection to earthquakes, and can be ignored unless extremely compelling correlation is proved. Similarly, the number of Toyota trucks driving across a fault presumably has no tectonic mechanism. In contrast, changes in fluid pressure in the crust can be related to failure mechanisms, and should not be ruled out so simply.
This important rule is specifically violated by machine learning methods that compress training data into potentially useful, but physically meaningless, form. That includes the AETA “big data” “machine learning” methods, and many other methods that try to conjure predictions out of data without committing to a mechanism, or at least a set of possible mechanisms.
Could some kind of revival of IASPEI-type guidelines help researchers, reviewers, editors, and reporters grapple with these kinds of papers more effectively? Or will we just keep writing these long posts about papers that get our hackles up?
For readers looking to better understand the sometimes disturbing, sometimes entertaining, and constantly accreting history of scientific earthquake prediction (as opposed to outright quackery), we highly recommend Dr. Susan Hough’s book: Predicting the Unpredictable: The Tumultuous Science of Earthquake Prediction, in addition to Geller (1997) and related papers.
As always, if anyone identifies any errors in our analysis and discussion, please let us know in the comments so we can fix them!
References:
AETA, 2002. AETA White Paper: Using big data & AI to forecast earthquakes. https://aeta.io/wp-content/uploads/2022/12/AETA-White-Paper-Second-Edition-2.0.pdf
Bradley, K., Hubbard, J., 2024. Does this machine learning model predict large earthquakes? Maybe not. Earthquake Insights, https://doi.org/10.62481/e64960d4
Geller, R.J., Earthquake prediction: a critical review, Geophysical Journal International, Volume 131, Issue 3, December 1997, Pages 425–450, https://doi.org/10.1111/j.1365-246X.1997.tb06588.x
Girona, T. and Drymoni, K., 2024. Abnormal low-magnitude seismicity preceding large-magnitude earthquakes. Nature Communications, 15(1), p.7429. https://doi.org/10.1038/s41467-024-51596-z

1 comment on PubPeer (by: Judith Hubbard)
1 comment on PubPeer (by: Judith Hubbard) 1 comment on PubPeer (by: Judith Hubbard) 1 comment on PubPeer (by: Judith Hubbard) 1 comment on PubPeer (by: Judith Hubbard) 1 comment on PubPeer (by: Judith Hubbard)
Hough, S.E., 2010. Predicting the unpredictable: the tumultuous science of earthquake prediction. Princeton University Press. https://press.princeton.edu/books/paperback/9780691173306/predicting-the-unpredictable?srsltid=AfmBOooF2uTsb7KnceqvONmiSVTPK7IzRweeODtcm_5gtYgXi8Lx5kbz
Saad, O.M., Chen, Y., Savvaidis, A., Fomel, S., Jiang, X., Huang, D., Oboué, Y.A.S.I., Yong, S., Wang, X.A., Zhang, X. and Chen, Y., 2023. Earthquake forecasting using big data and artificial intelligence: A 30‐week real‐time case study in China. Bulletin of the Seismological Society of America, 113(6), pp.2461-2478. https://doi.org/10.1785/0120230031
1 comment on PubPeer (by: Judith Hubbard)
Thosberg, C., 2024. Coud A.I. help seismologists predict major earthquakes? Smithsonian Magazine, https://www.smithsonianmag.com/smart-news/ai-help-seismologists-predict-major-earthquakes-180983519/
Wang, C., Li, C., Yong, S., Wang, X.A. and Yang, C., 2022. Time Series and Non-Time Series Models of Earthquake Prediction Based on AETA Data: 16-Week Real Case Study. Applied Sciences, 12(17), p.8536. https://doi.org/10.3390/app12178536
Xie, J., Yong, S., Wang, X.A., Bao, Z., Liu, Y., Zhang, X. and He, C., 2022. Weekly earthquake prediction in a region of China based on an intensive precursor network AETA. Frontiers in Earth Science, 10, p.902745. https://doi.org/10.3389/feart.2022.902745
Great article. Maybe a typo here: the formula for accuracy is (TP + TN) / (TP + TN + FP + FN)
Wonderful analysis ! The Saad et al posted their data/models in figshare: https://figshare.com/projects/EqPred/146166. Inspired by your analysis, I plan to analyze and figure out the model they used and provide additional analysis of why these ML-based approaches isn't gonna solve prediction/forecasting challenge :)