

Southern Japan shaken by M6.4 earthquake
Southern Japan shaken by M6.4 earthquake
A new earthquake joins the menagerie of Bungo Channel seismicity


A magnitude 6.4 earthquake struck southern Japan on April 17, 2024 at 23:14 local time (14:14 UTC). The earthquake occurred below the Bungo Channel, the body of water that separates the islands of Shikoku and Kyushu. Felt reports to the Japanese Meteorological Agency indicate that earthquake was widely felt on both islands, as well as the nearby southern part of Honshu.
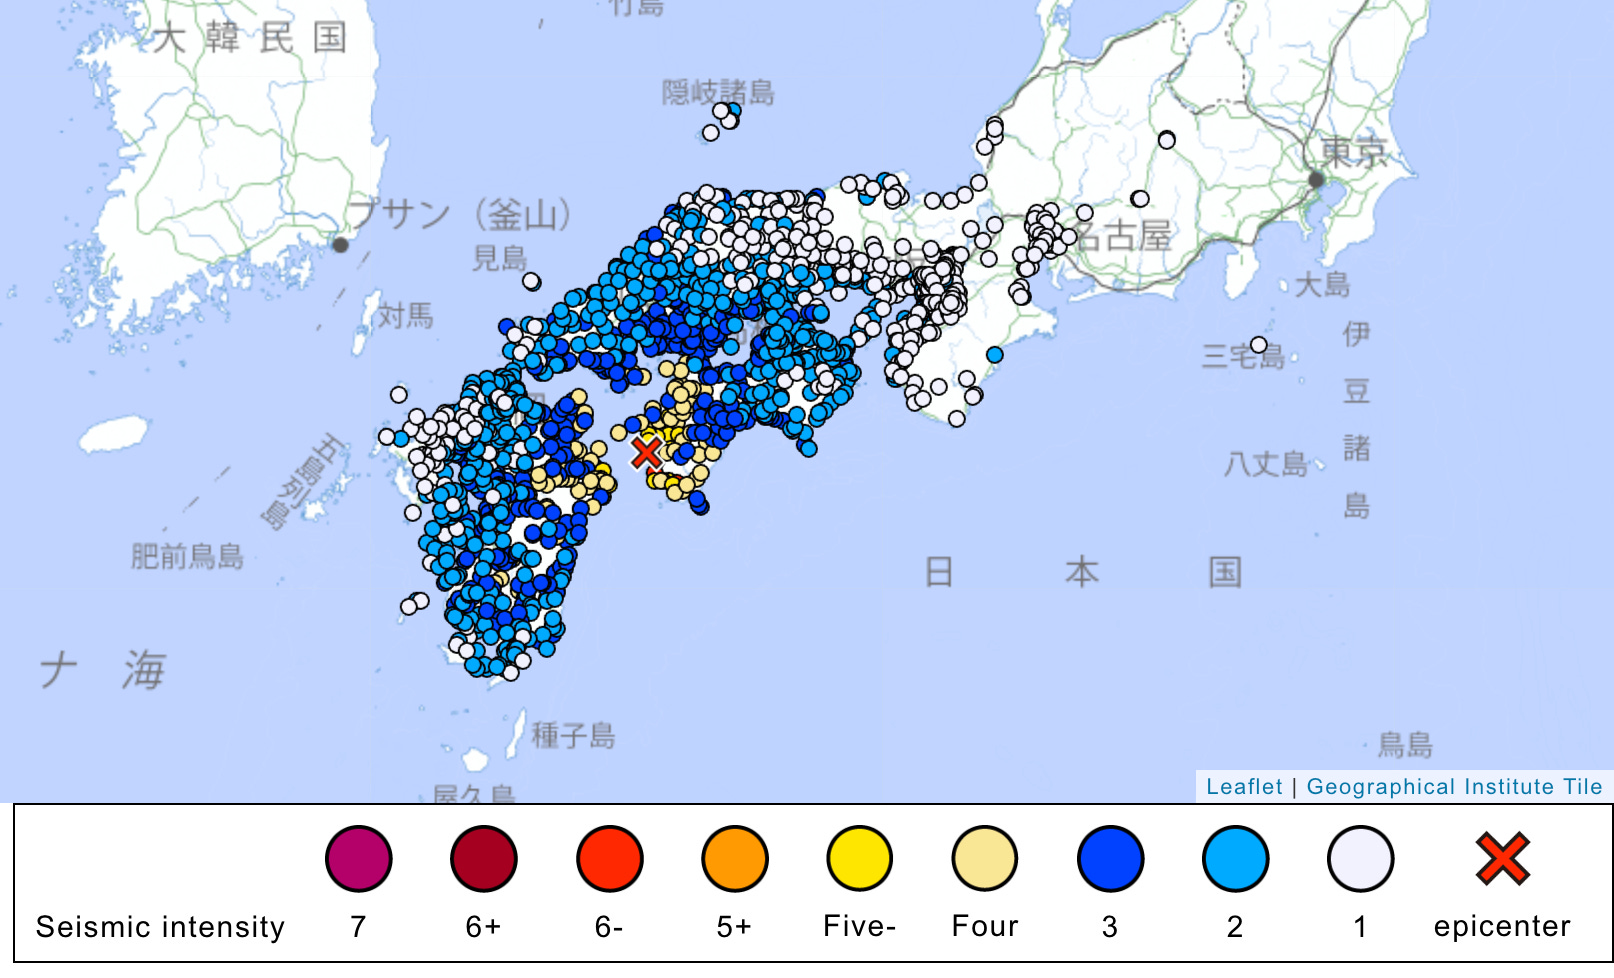
The strongest shaking reached 6- on the shindo intensity scale (approximately equal to a Modified Mercalli Intensity of VIII, the scale more commonly used in the US and Europe); this shaking was reported at the town of Ainan in Shikoku, near the epicenter. Shaking at this level can cause some structural damage, especially for houses with low earthquake resistance. We note that the vast majority of areas that experienced shaking reported intensities of 5- or lower, which is not expected to cause structural damage. Reports indicate that there has been some minor damage, including fallen streetlights, broken water pipes, and a landslide.

Although a M6.4 earthquake is large, this event was much smaller than the January 1, 2024 M7.5 earthquake that struck the Noto Peninsula of Japan. The magnitude scale is logarithmic: every increment of 1 is associated with about thirty times more energy release. So, this event was about fifty times less powerful than the Noto earthquake. (For Americans who felt the recent M4.8 earthquake in New Jersey, the conversion works the other way - this M6.4 earthquake was ~250 times more powerful.)
Tectonic setting
Why is Japan so seismically active? The answer lies in plate tectonics. Japan sits above two different subduction zones — places where two tectonic plates converge, and one sinks into the mantle. This process does not happen smoothly: it requires plates to bend, break, and slide past each other. In the process, large areas around the subduction zone are also stressed, causing the formation of faults, and the triggering of earthquakes, across a large region.
The subduction zone below southern Japan is marked by the Nankai Trough, located about 150 kilometers southeast of Shikoku. To visit the Nankai Trough, you would have to hire a (reliable!) submersible and sink below 5 kilometers of sea water.
Here, the Philippine Sea Plate is moving northwestward about 6-7 cm each year, and sinking beneath Japan. This process causes large numbers of earthquakes. In this region, the most notable earthquake in recent years was the 2016 M7 Kumamoto earthquake in Kyushu. That event, which was preceded by a M6.2 foreshock about a day earlier, killed 273 people. The Kumamoto earthquakes occurred on a shallow strike-slip fault, west of the recent M6.4 (shown in red on the map below).
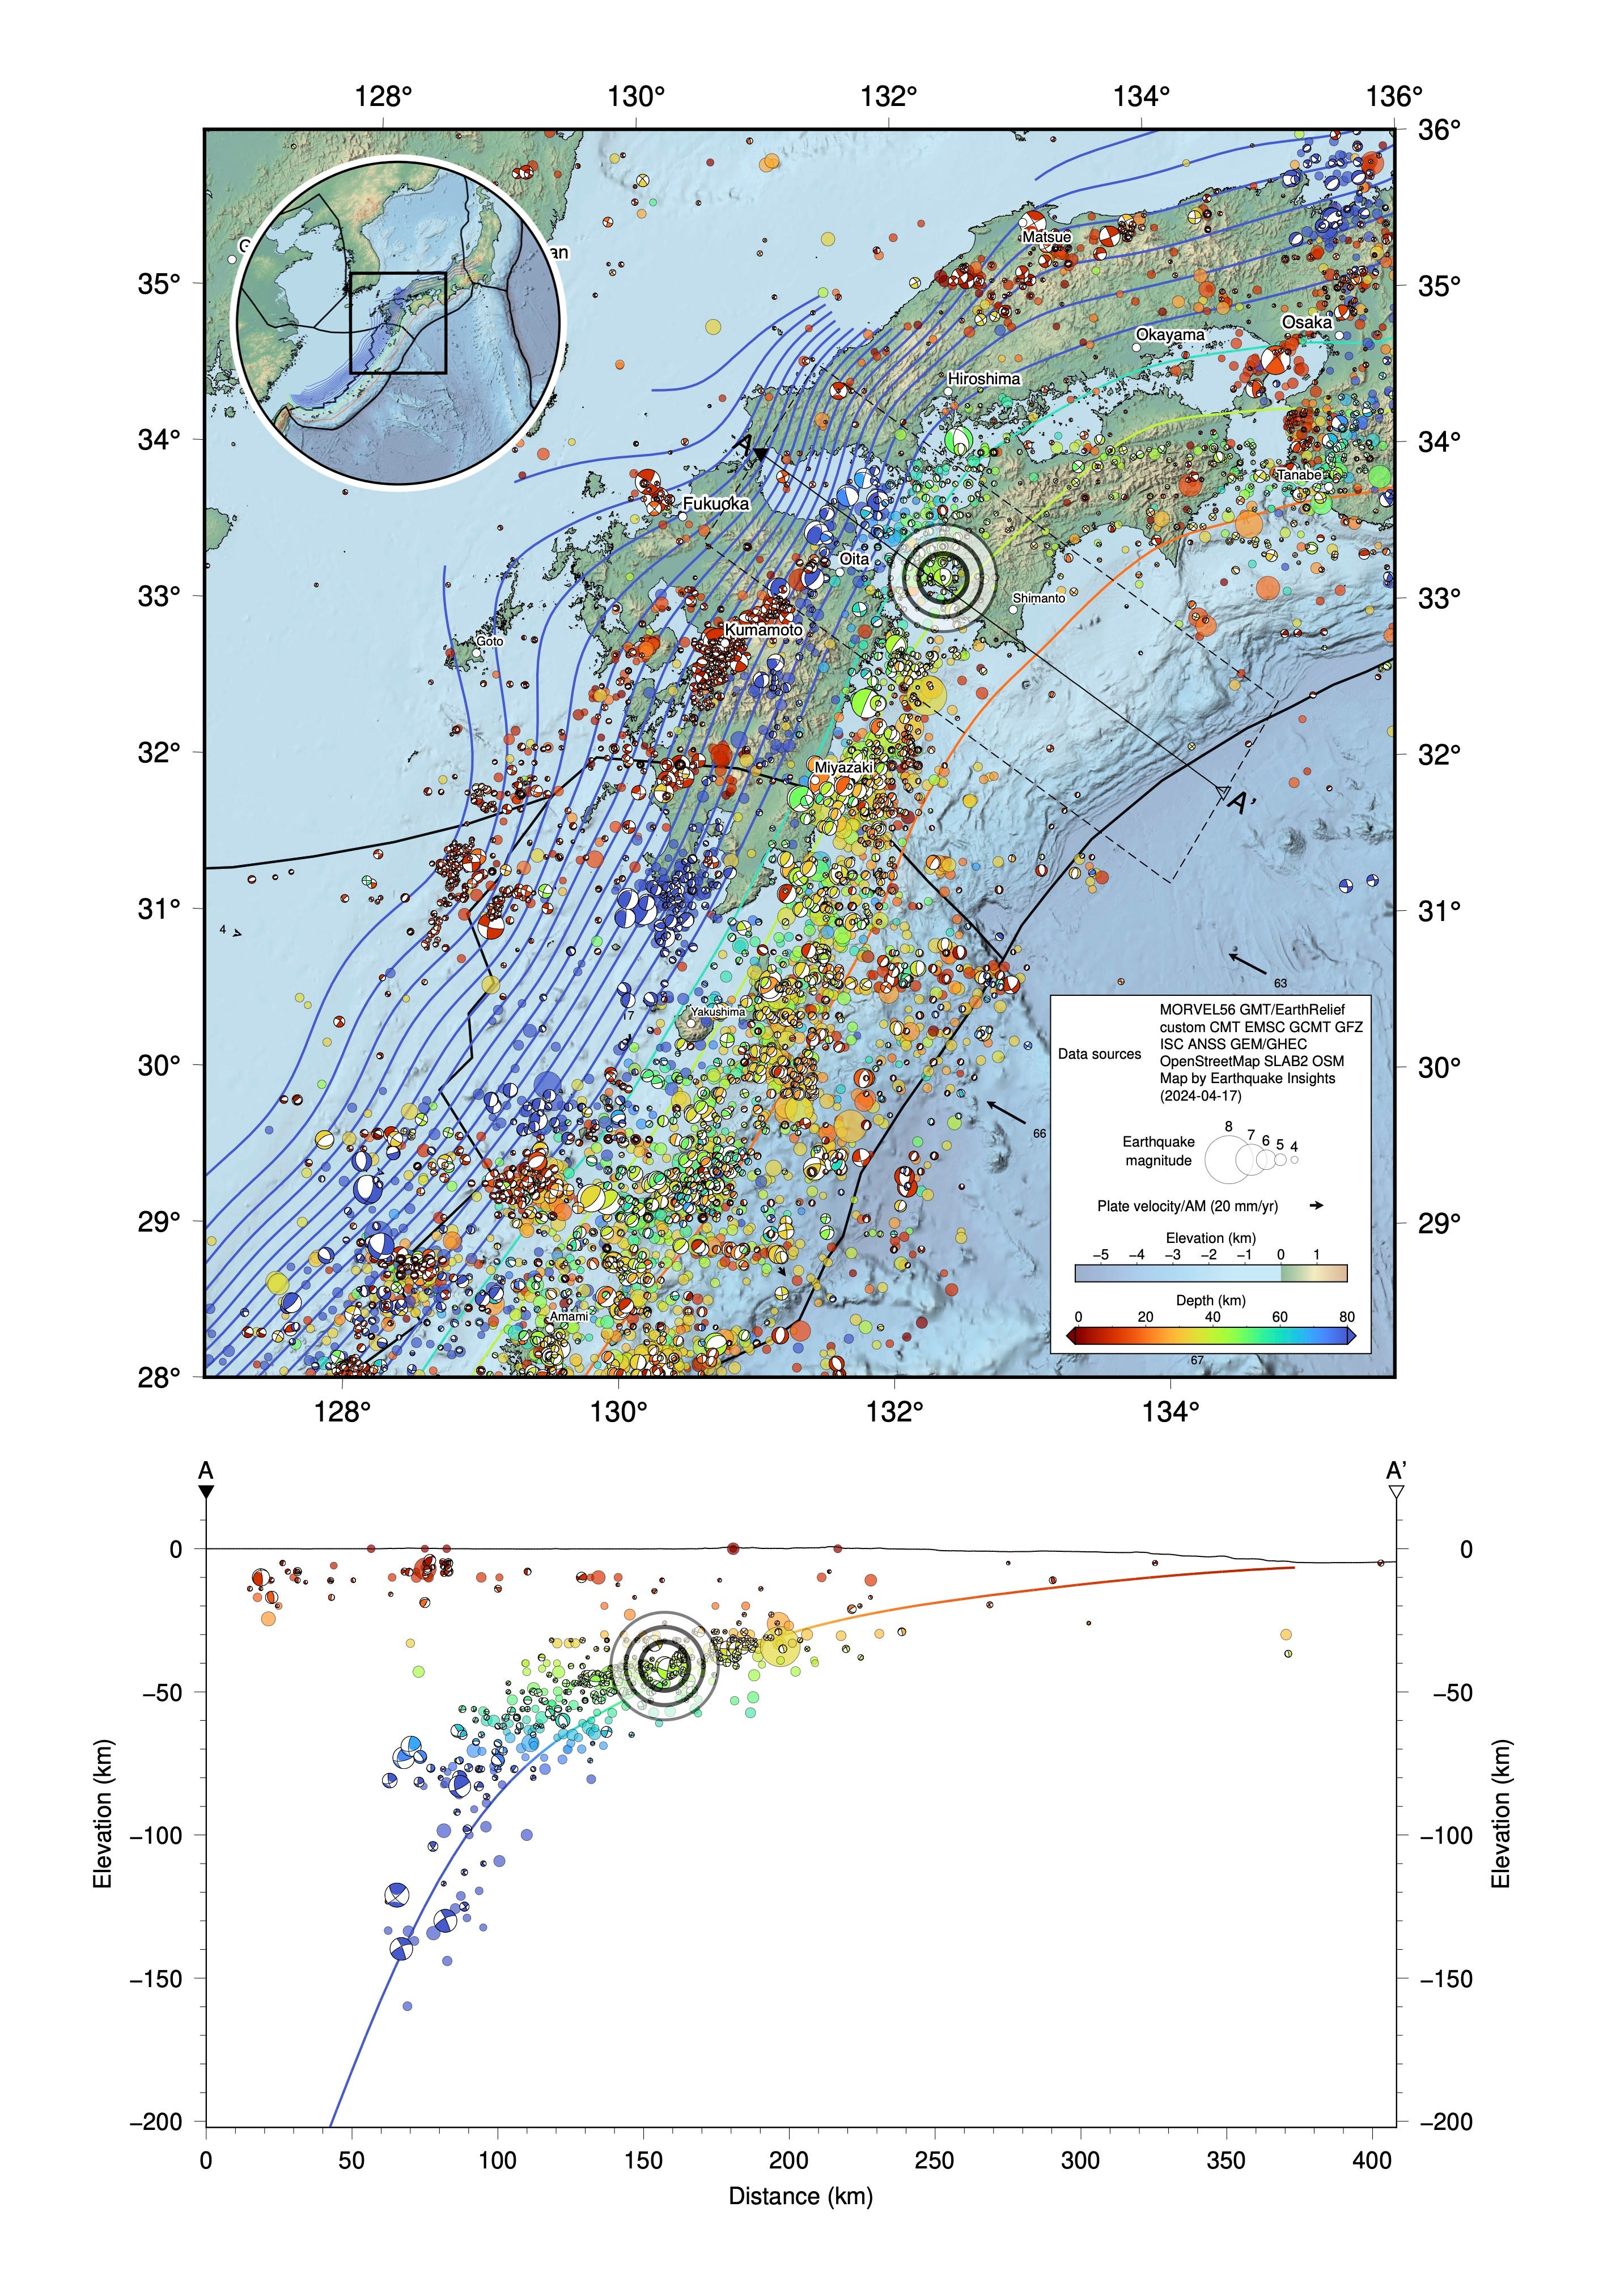
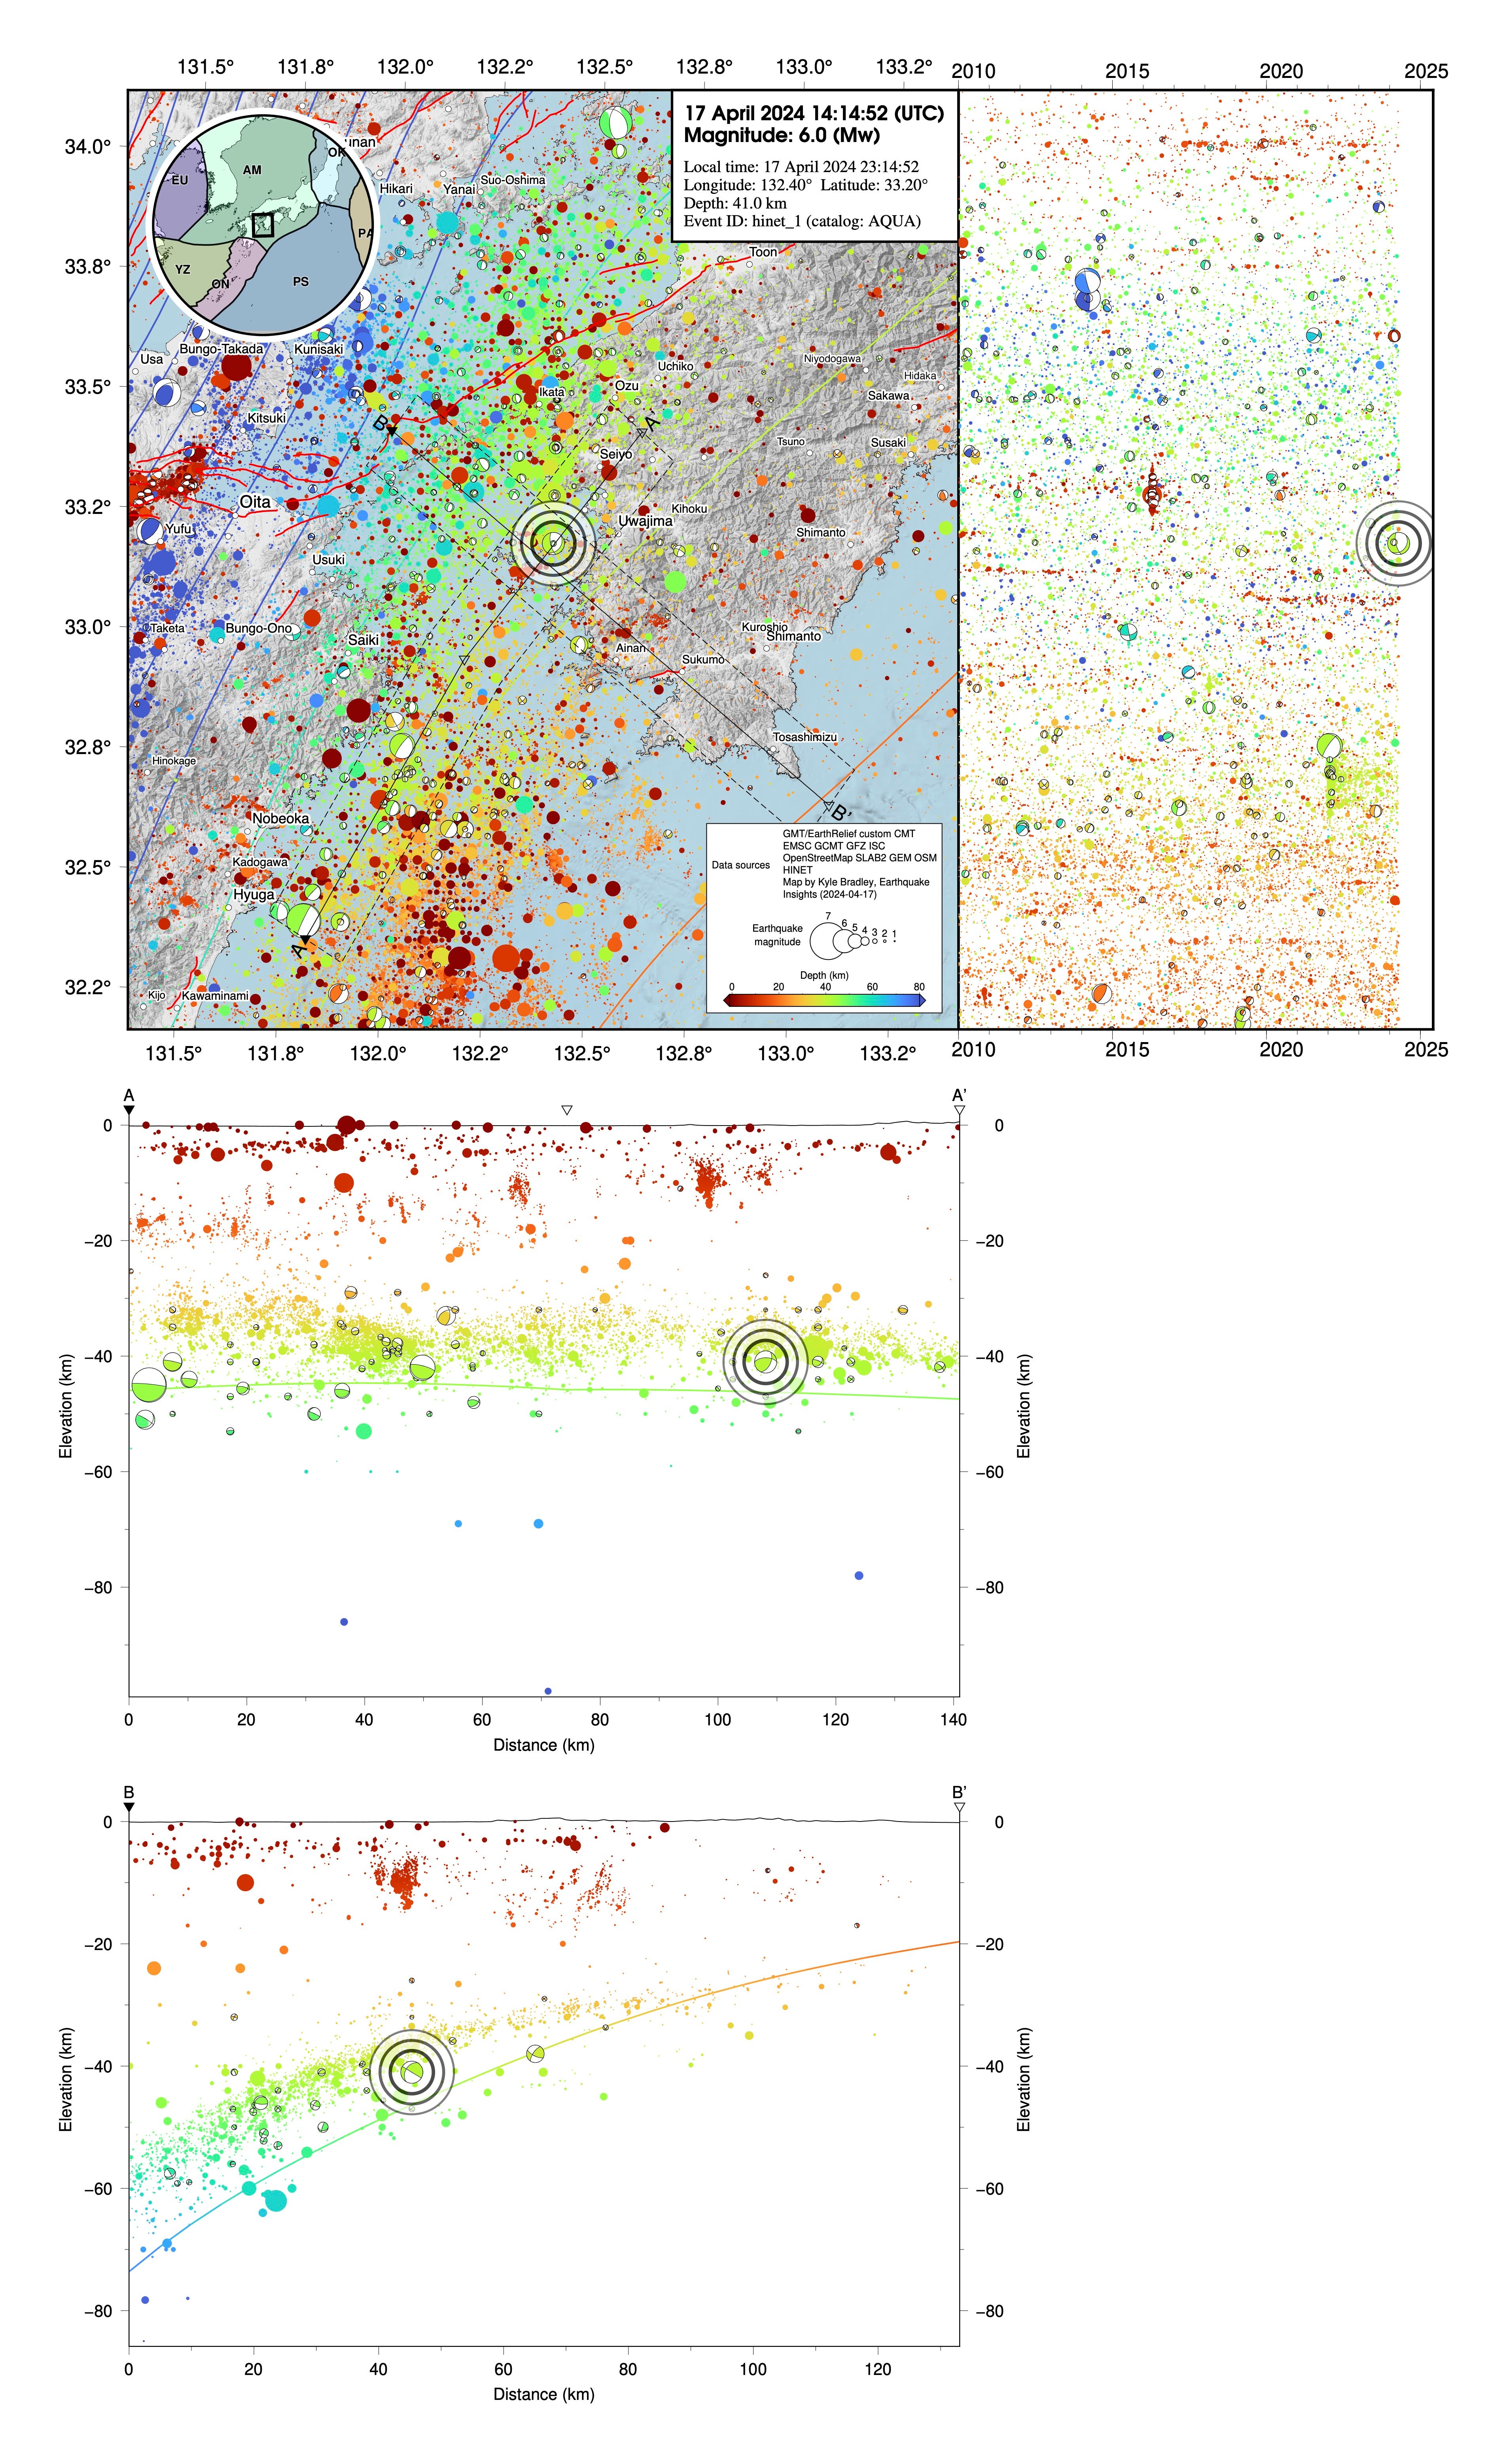
In contrast, the recent earthquake occurred at ~40-50 km depth (as reported by JMA). This places the quake within the sinking slab itself. The focal mechanism of the earthquake tells us that this was a normal-type earthquake - having occurred either on a very steep fault dipping to the west, or a very low-angle fault dipping to the southeast. Neither of these orientations matches the subduction interface, which here dips to the northwest. Instead, this suggests that the earthquake was an intraslab event: an earthquake associated with fracturing of the Philippine Sea Plate itself as it bends downward into the mantle. A number of similar earthquakes have occurred within the slab, although most are much smaller; most recently a M6.3 in January 2022.
We note that the USGS reports the depth of this event at 25.7 km, and the EMSC reports it at 26 km, which would place the earthquake above the slab. However, given Japan’s dense seismic network, we expect that the epicentral location provided by JMA is more accurate. In fact, when we plotted up seismicity from the JMA catalog for this region, we noticed that earthquakes very clearly map out the shape of the subducting slab here. We compared those earthquakes to the USGS Slab2.0 model for the region, which is based in part on global seismic catalogs; at the location of the recent M6.4, it appears that the Slab2.0 model is about 10 km too deep.
The focal mechanism provides two possible fault orientations: one dipping 77° to the west, the other 20° to the southeast. Can we guess which one was responsible?
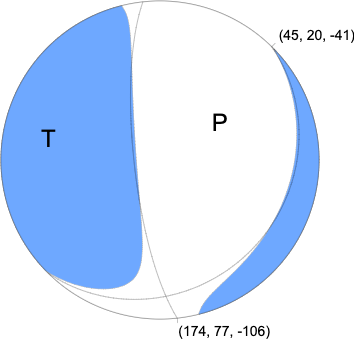
Subducting slabs actually start to develop normal faults quite early, as the slab begins to bend downward outboard of the trench. Those faults typically form parallel to the subduction zone, dipping at ~60° in either direction. As the slab bends downward, the fault rotate along with the slab - so the faults that previously dipped 60° in the direction of subduction become steeper, while those that dipped away from the direction of subduction become shallower. Each of the two potential fault planes therefore sort of makes sense as a structure: one dipping steeply in the direction of subduction, the other dipping gently away. Which fault ruptured may remain a mystery - but it is very clear that it can’t be the megathrust.

An earthquake menagerie at the Nankai Trough
While we usually talk about earthquakes in this newsletter - the seismic waves that are emitted from rapid ruptures of faults - the real world of fault slip can be much more complicated. Subduction zones in particular often slip in a mix of styles, over a range of time scales, and there is no better place to observe these processes than the Nankai Trough.
Ultimately, when two plates collide, the relative motion between them has to be accommodated - but whether it occurs as creep (constant, seismically quiet slip, at about the same rate as the overall plate motion), as earthquakes (meters of slip happening over a few seconds, followed by centuries of quiescence), or as something in between (slow slip) depends on where the fault is, its temperature, and fluids in the rock.
Nankai is basically a textbook case of how these different styles of slip can interact and evolve over time. While we will briefly summarize some of these ideas here, it is important to note that these observations are at the cutting edge of earthquake science, and we will likely see many new and interesting ideas arise as more observations are made here.
A figure from a recent paper on the Bungo Channel area (Hirose et al., 2023) tells a lot of the story. On the map below, the dashed black lines are contours of the subduction interface - they locate the actual fault surface at depth. The dark purple squiggly lines show the approximate slip areas of large earthquakes that occurred in 1946 and 1968. This area of the subduction fault has produced truly great earthquakes historically, but not lately, geologically speaking. So, one can appreciate why any unusual earthquake activity in this area gets special attention. The large green circles show areas of long-term slow slip events - areas that slipped as if in earthquakes, but much more slowly - over months, rather than seconds. Finally, the orange and pink dots mark tremor: weak seismic signals that occur over long(ish) time periods (~minutes) likely related to earthquake-like fault slip under high fluid pressure. The recent M6.4 earthquake (yellow star) occurred right in the middle of all of this action: updip of deep tremor, in an area where the megathrust experiences periodic slow slip.

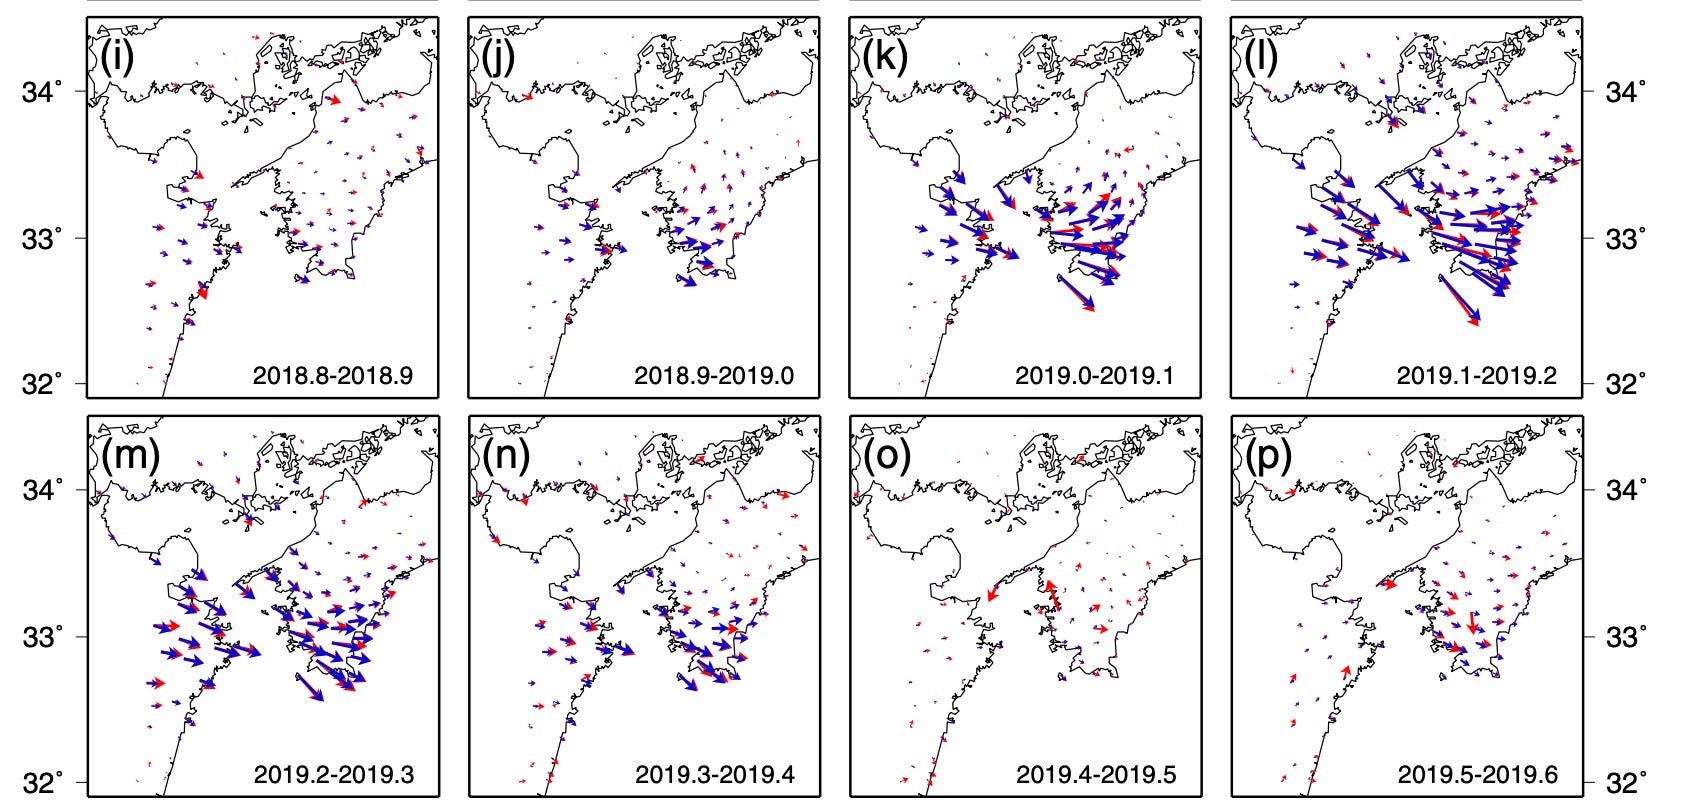
The slow slip events below the Bungo Channel are pretty spectacular. Here’s a map of GPS displacements over time (the frame durations are in decimal years… interesting). You can see how the land surface (where the GPS stations are) surges forward toward the trench for a few months, and then stops. This is the same basic pattern of deformation that a magnitude ~7 earthquake would cause - just over a much longer and safer time window!
The history of the Bungo Channel slow slip events is pretty amazing, partly because the slip events in different years are often extremely similar to each other. This means that the same patch of fault slipped the same amount over the same time period.
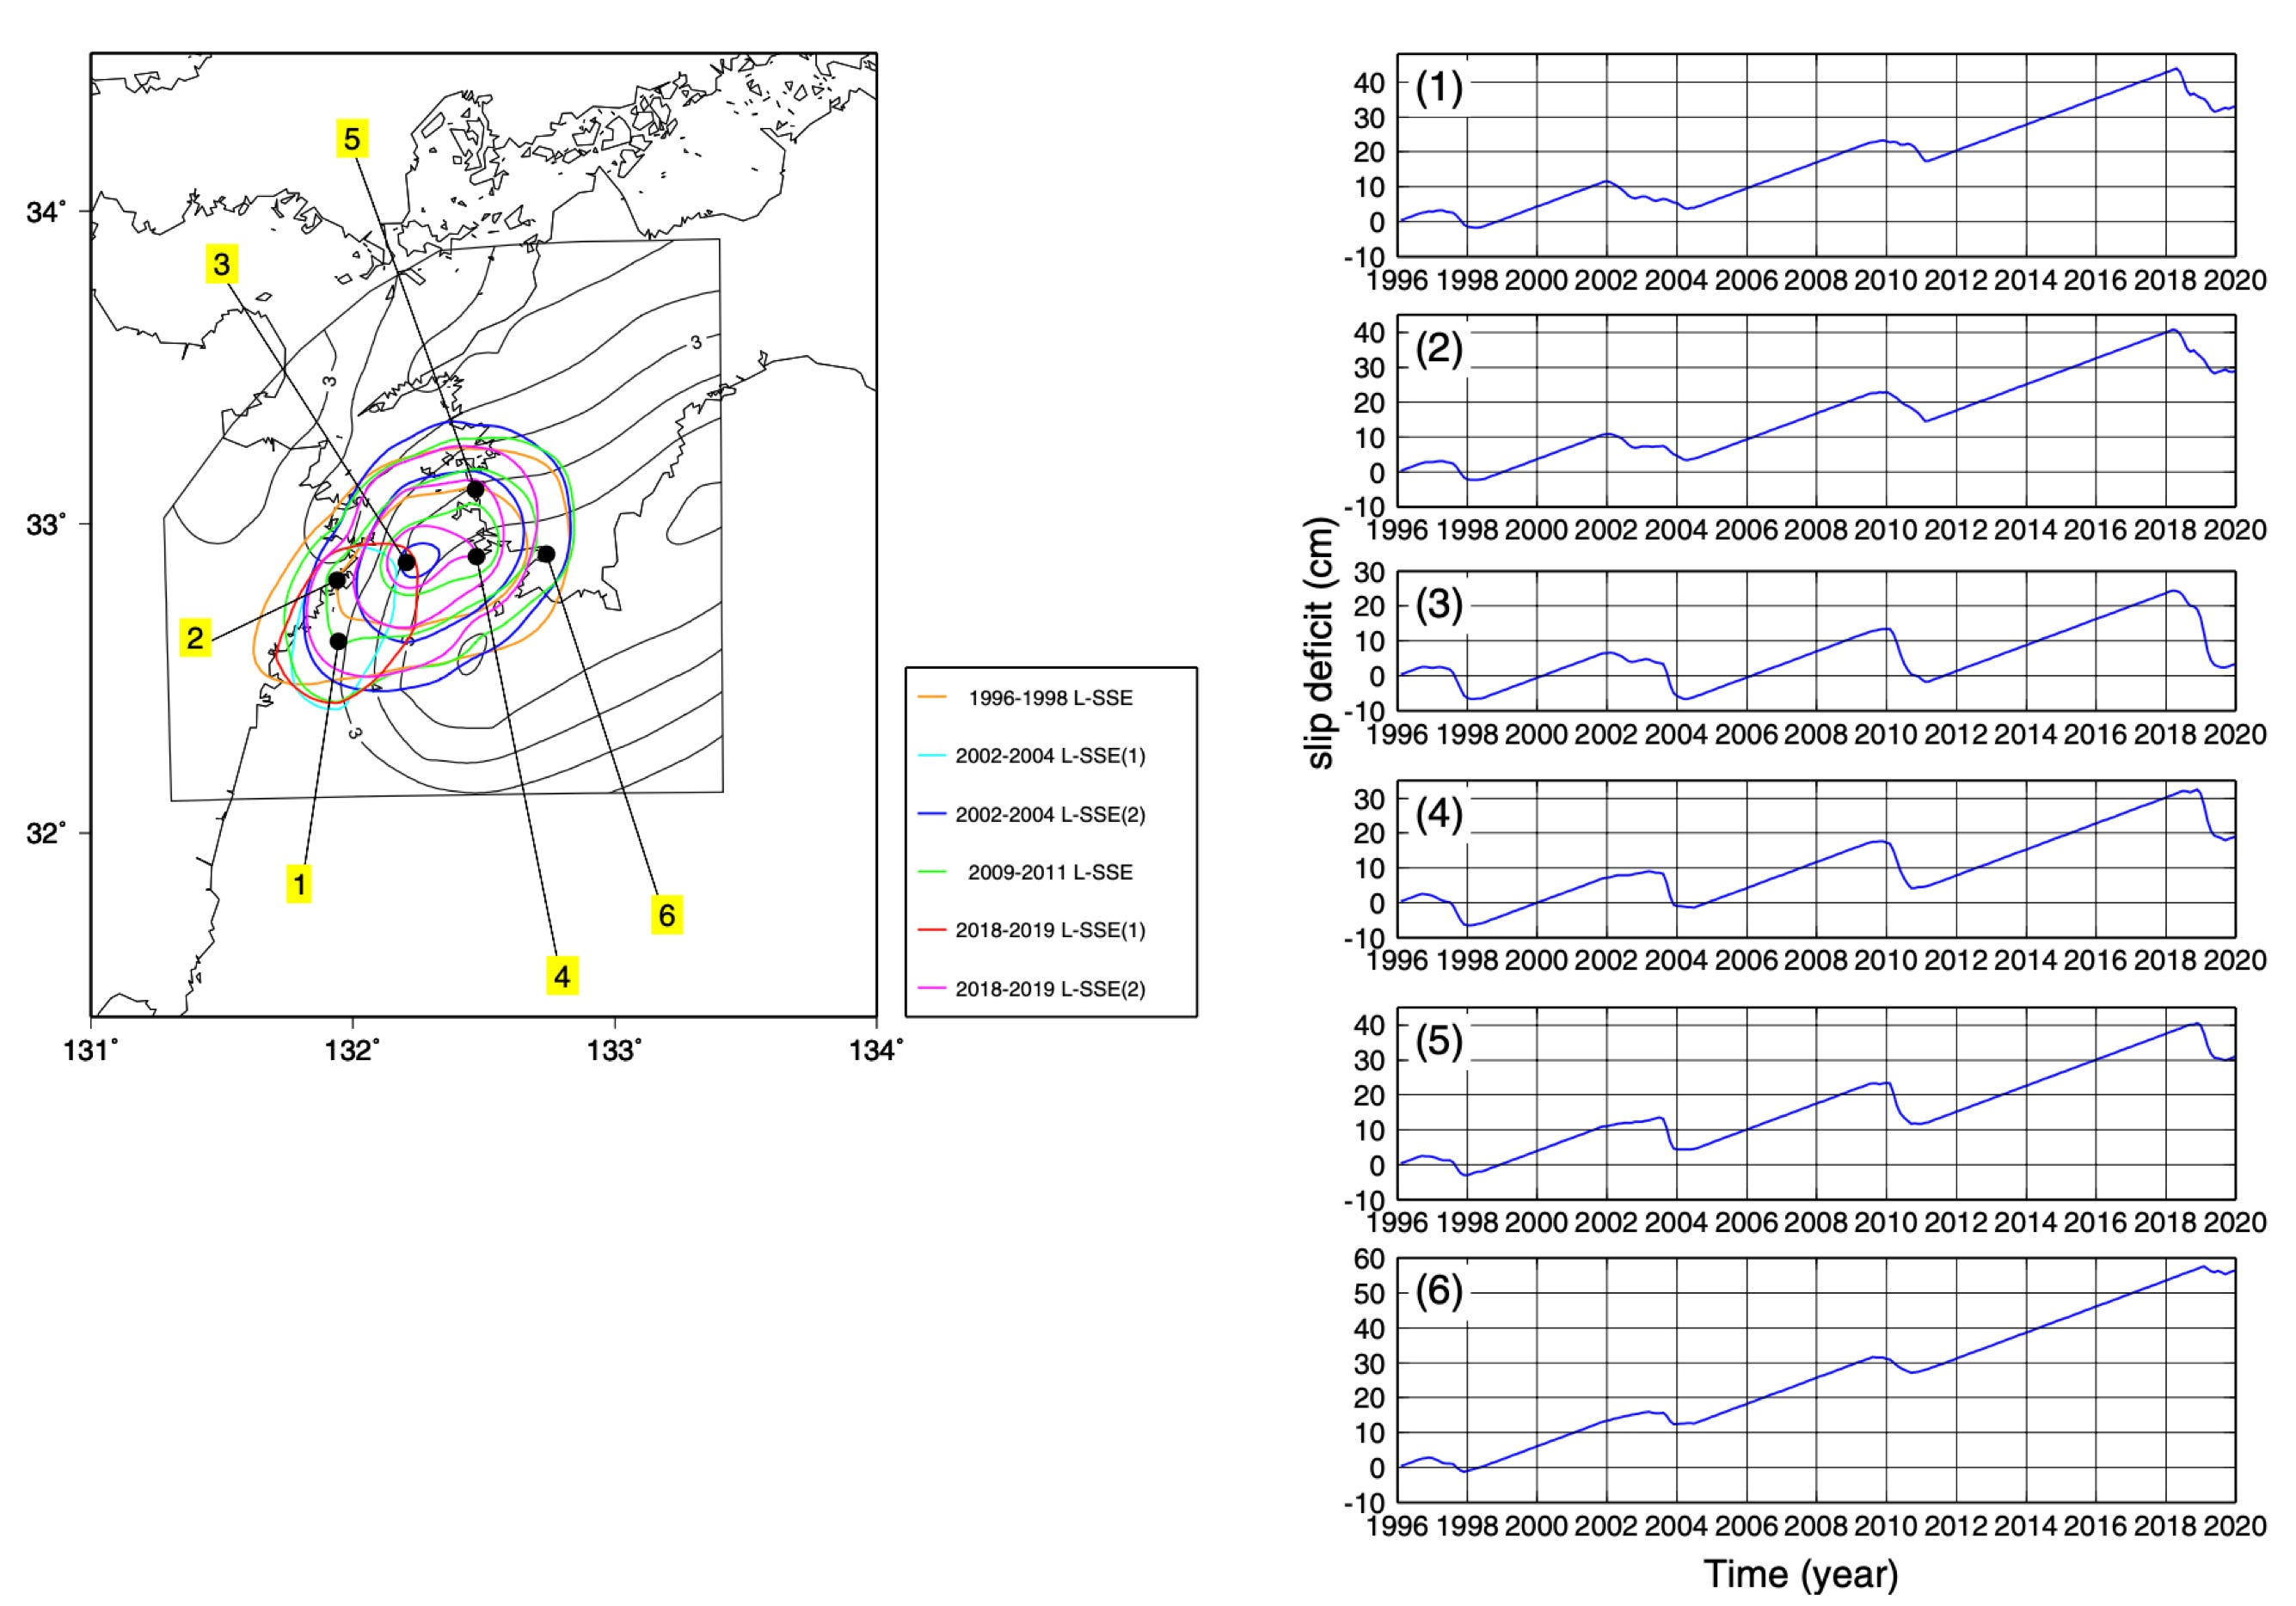
The figure below shows a map of the slow slip event areas (the colored contours - each color is a different slip event), and also shows the motions of six different selected GPS sites. You can see how there is a constant upward trend to the blue curves - this is plate motion, as the fault ‘catches’ and the subducting slab drags the plate away from the sea. This constant background trend is interrupted by downward jogs - these are the slow slip events, where the upper plate is released for a little while, and moves back toward its preferred location.
This level of repeatability is basically nonexistent for fast earthquakes - and is one reason why people who want to know how faults “work” gravitate toward these events. The Earth rarely produces such consistently replicable experiments!
Based on the past decades of data, we are likely to see another slow slip event in the region around the April 17 earthquake, over the coming years. While we found a reference showing no sign slow slip up through mid-2023, we haven’t looked at the GPS data ourselves and we don’t know what’s happening right now.
Of course, it is important to remember that the April 17 earthquake was probably located in the subducting slab rather than on the megathrust above. That means it isn’t directly tied to these behaviors. On the other hand, the internal stresses within the slab are likely related to what is going on on the plate interface just above. Similarly, a large earthquake within the slab could disturb the delicate balance on the megathrust above.
One thing that has not been recorded instrumentally at Nankai is a large megathrust earthquake. The region of the megathrust updip (closer to the trench) of the slow slip zone, and to the north of the shallow tremor (pink dots), does not seem to have these stress-releasing slow slip events. When a plate is moving but the fault above it isn’t slipping, that is a clear sign that energy is being stored up, which could be released in a large earthquake. We know that this subduction zone produced a M8.1 in 1944 (to the northeast of the map area) and a M8.1-8.4 in 1946, and long historical records tell us of a number of other large earthquakes over the previous centuries. So, it is clear that there is a potential for large, tsunamigenic earthquakes here.
In the end, the April 17 earthquake seems to be an unusually large example of a relatively common type of event, probably caused by bending of the subducting slab. This earthquake should be large enough to produce a significant aftershock sequence, and also disturb the dense GPS network in the surrounding area. It will be pretty interesting to see how the experts on the complex earthquake processes in this region interpret this event.
References:
Billen, M., 2009. Soaking slabs./ Nature Geosci 2, 744–746. https://doi.org/10.1038/ngeo674
Bradley, K., Hubbard, J., 2024. M4.8 New Jersey earthquake shakes Northeastern United States. Earthquake Insights, https://doi.org/10.62481/f02ed1c5
Hayes, G.P., Moore, G.L., Portner, D.E., Hearne, M., Flamme, H., Furtney, M. and Smoczyk, G.M., 2018. Slab2, a comprehensive subduction zone geometry model. Science, 362(6410), pp.58-61. https://doi.org/10.5066/F7PV6JNV
Hirose, H., Matsushima, T., Tabei, T. and Nishimura, T., 2023. Long-term slow slip events with and without tremor activation in the Bungo Channel and Hyuganada, southwest Japan. Earth, Planets and Space, 75(1), p.77. https://doi.org/10.1186/s40623-023-01833-4
Hubbard, J. and Bradley, K., 2024. M7.5 earthquake strikes western Japan, triggers tsunami. Earthquake Insights, https://doi.org/10.62481/e8bf9b2e
Seshimo, Y. and Yoshioka, S., 2022. Spatiotemporal slip distributions associated with the 2018–2019 Bungo Channel long-term slow slip event inverted from GNSS data. Scientific reports, 12(1), p.343. https://doi.org/10.1038/s41598-021-03982-6
Shelly, D.R., Beroza, G.C. and Ide, S., 2007. Non-volcanic tremor and low-frequency earthquake swarms. Nature, 446(7133), pp.305-307. https://doi.org/10.1038/nature05666