

M6.5 earthquake strikes offshore western Canada
M6.5 earthquake strikes offshore western Canada
Comparing Canada to California: A tale of two North American-Pacific transform plate boundaries


Earthquake Insights is an ad-free newsletter written by two earthquake scientists. Our posts are written for a general audience, with some advanced science thrown in! To get these posts delivered by email, become a free subscriber. If you would like to support our work here, please also consider a paid subscription.
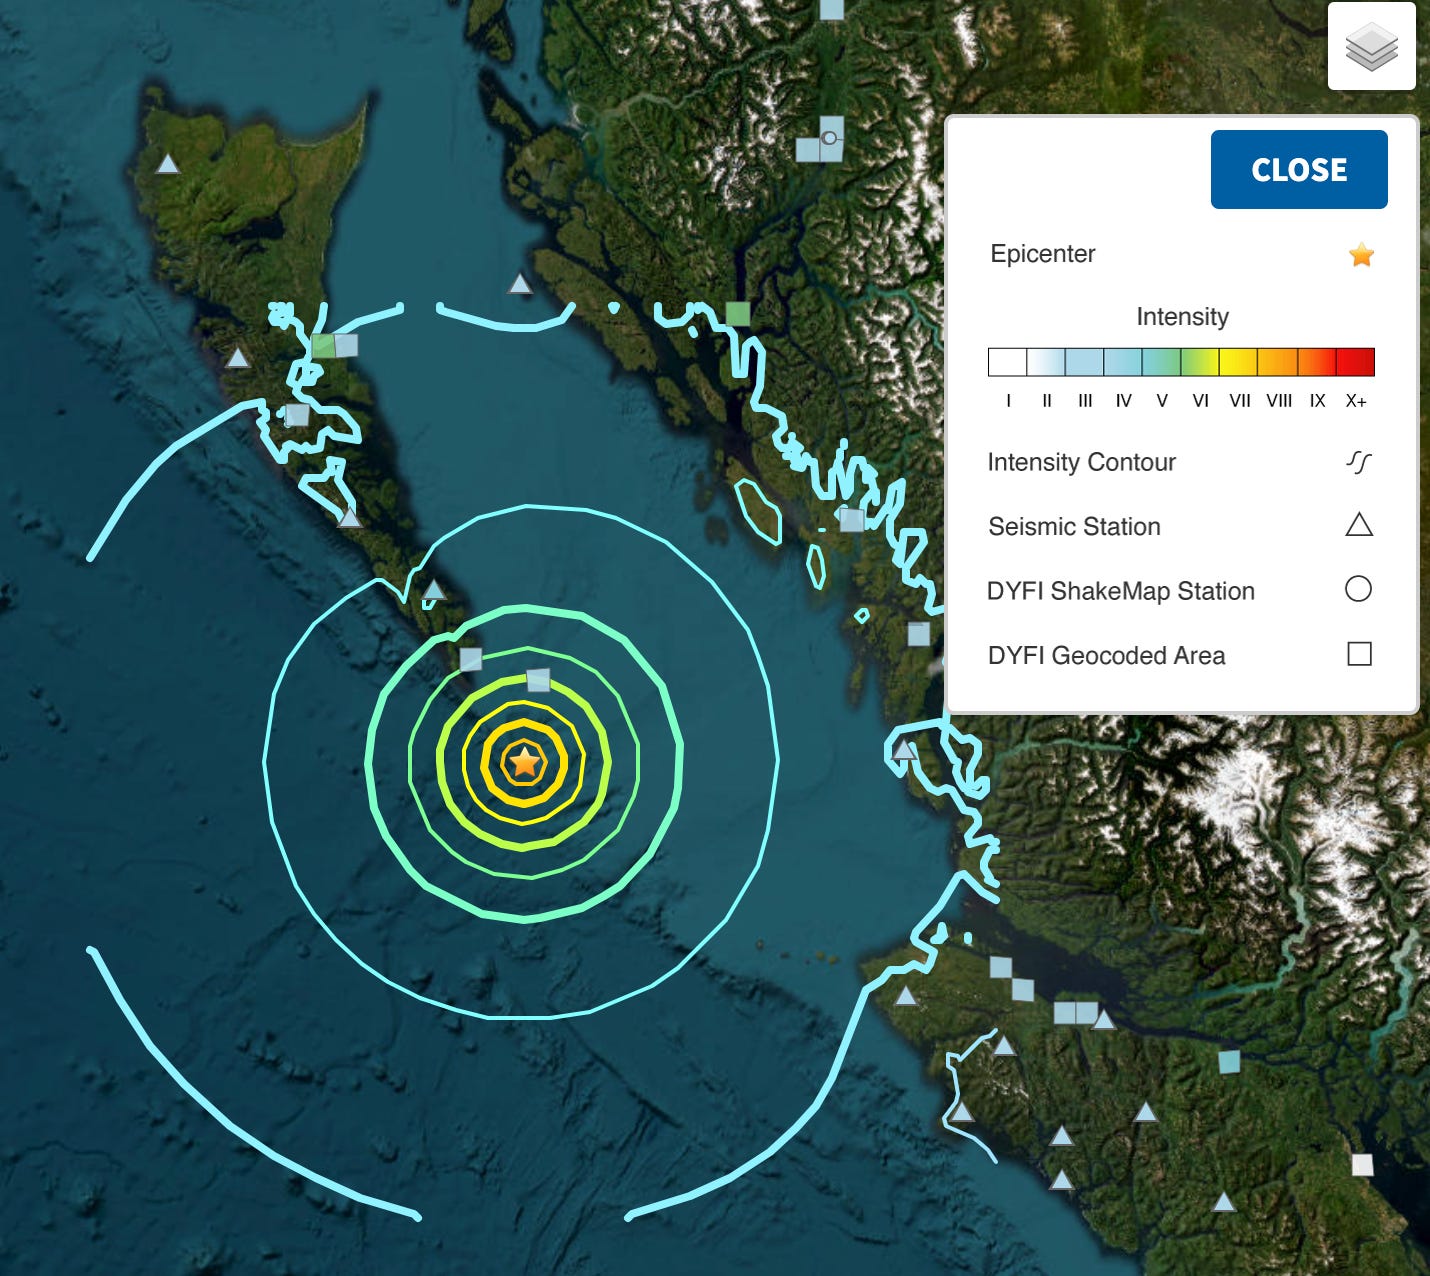
On September 15, 2024, a magnitude 6.5 earthquake struck the plate boundary between the Pacific and North American Plates: a strike-slip event on a ~1000-km-long transform fault system. Fortunately for the residents of North America, this earthquake did not occur on the San Andreas Fault, but rather on its sister fault to the north: the Queen Charlotte-Fairweather system. For this reason, instead of causing an uproar with reports of damage, the earthquake went mostly unremarked. Maximum shaking intensities reached intensity IV (light); the USGS PAGER estimates that ~2,000 people experienced shaking of this intensity. 88 people reported shaking to the USGS.
We have written about the Queen Charlotte-Fairweather Fault system before. On January 12, 2024, a M5.9 earthquake occurred on this system offshore Alaska, to the north of the latest earthquake. On July 11, a M6.4 earthquake occurred to the south offshore Vancouver Island; here the plate boundary changes as the Juan de Fuca Plate is sandwiched between the North American and Pacific Plates. (We have made those two earlier posts free to read, for those looking for a tectonic description of the region.)
Either of those earthquakes would have caused quite a stir if they had occurred on the plate boundary farther south, in California — but the largest earthquake on that plate boundary this year was far smaller: a M5.2 near Bakersfield, CA on August 7.
Why have so many earthquakes happened on the Canadian/Alaskan section of the plate boundary — or should the question be: why have so few happened on the Californian section? It is interesting to compare different regions, but challenging to give reliable answers! We need to look at the data.
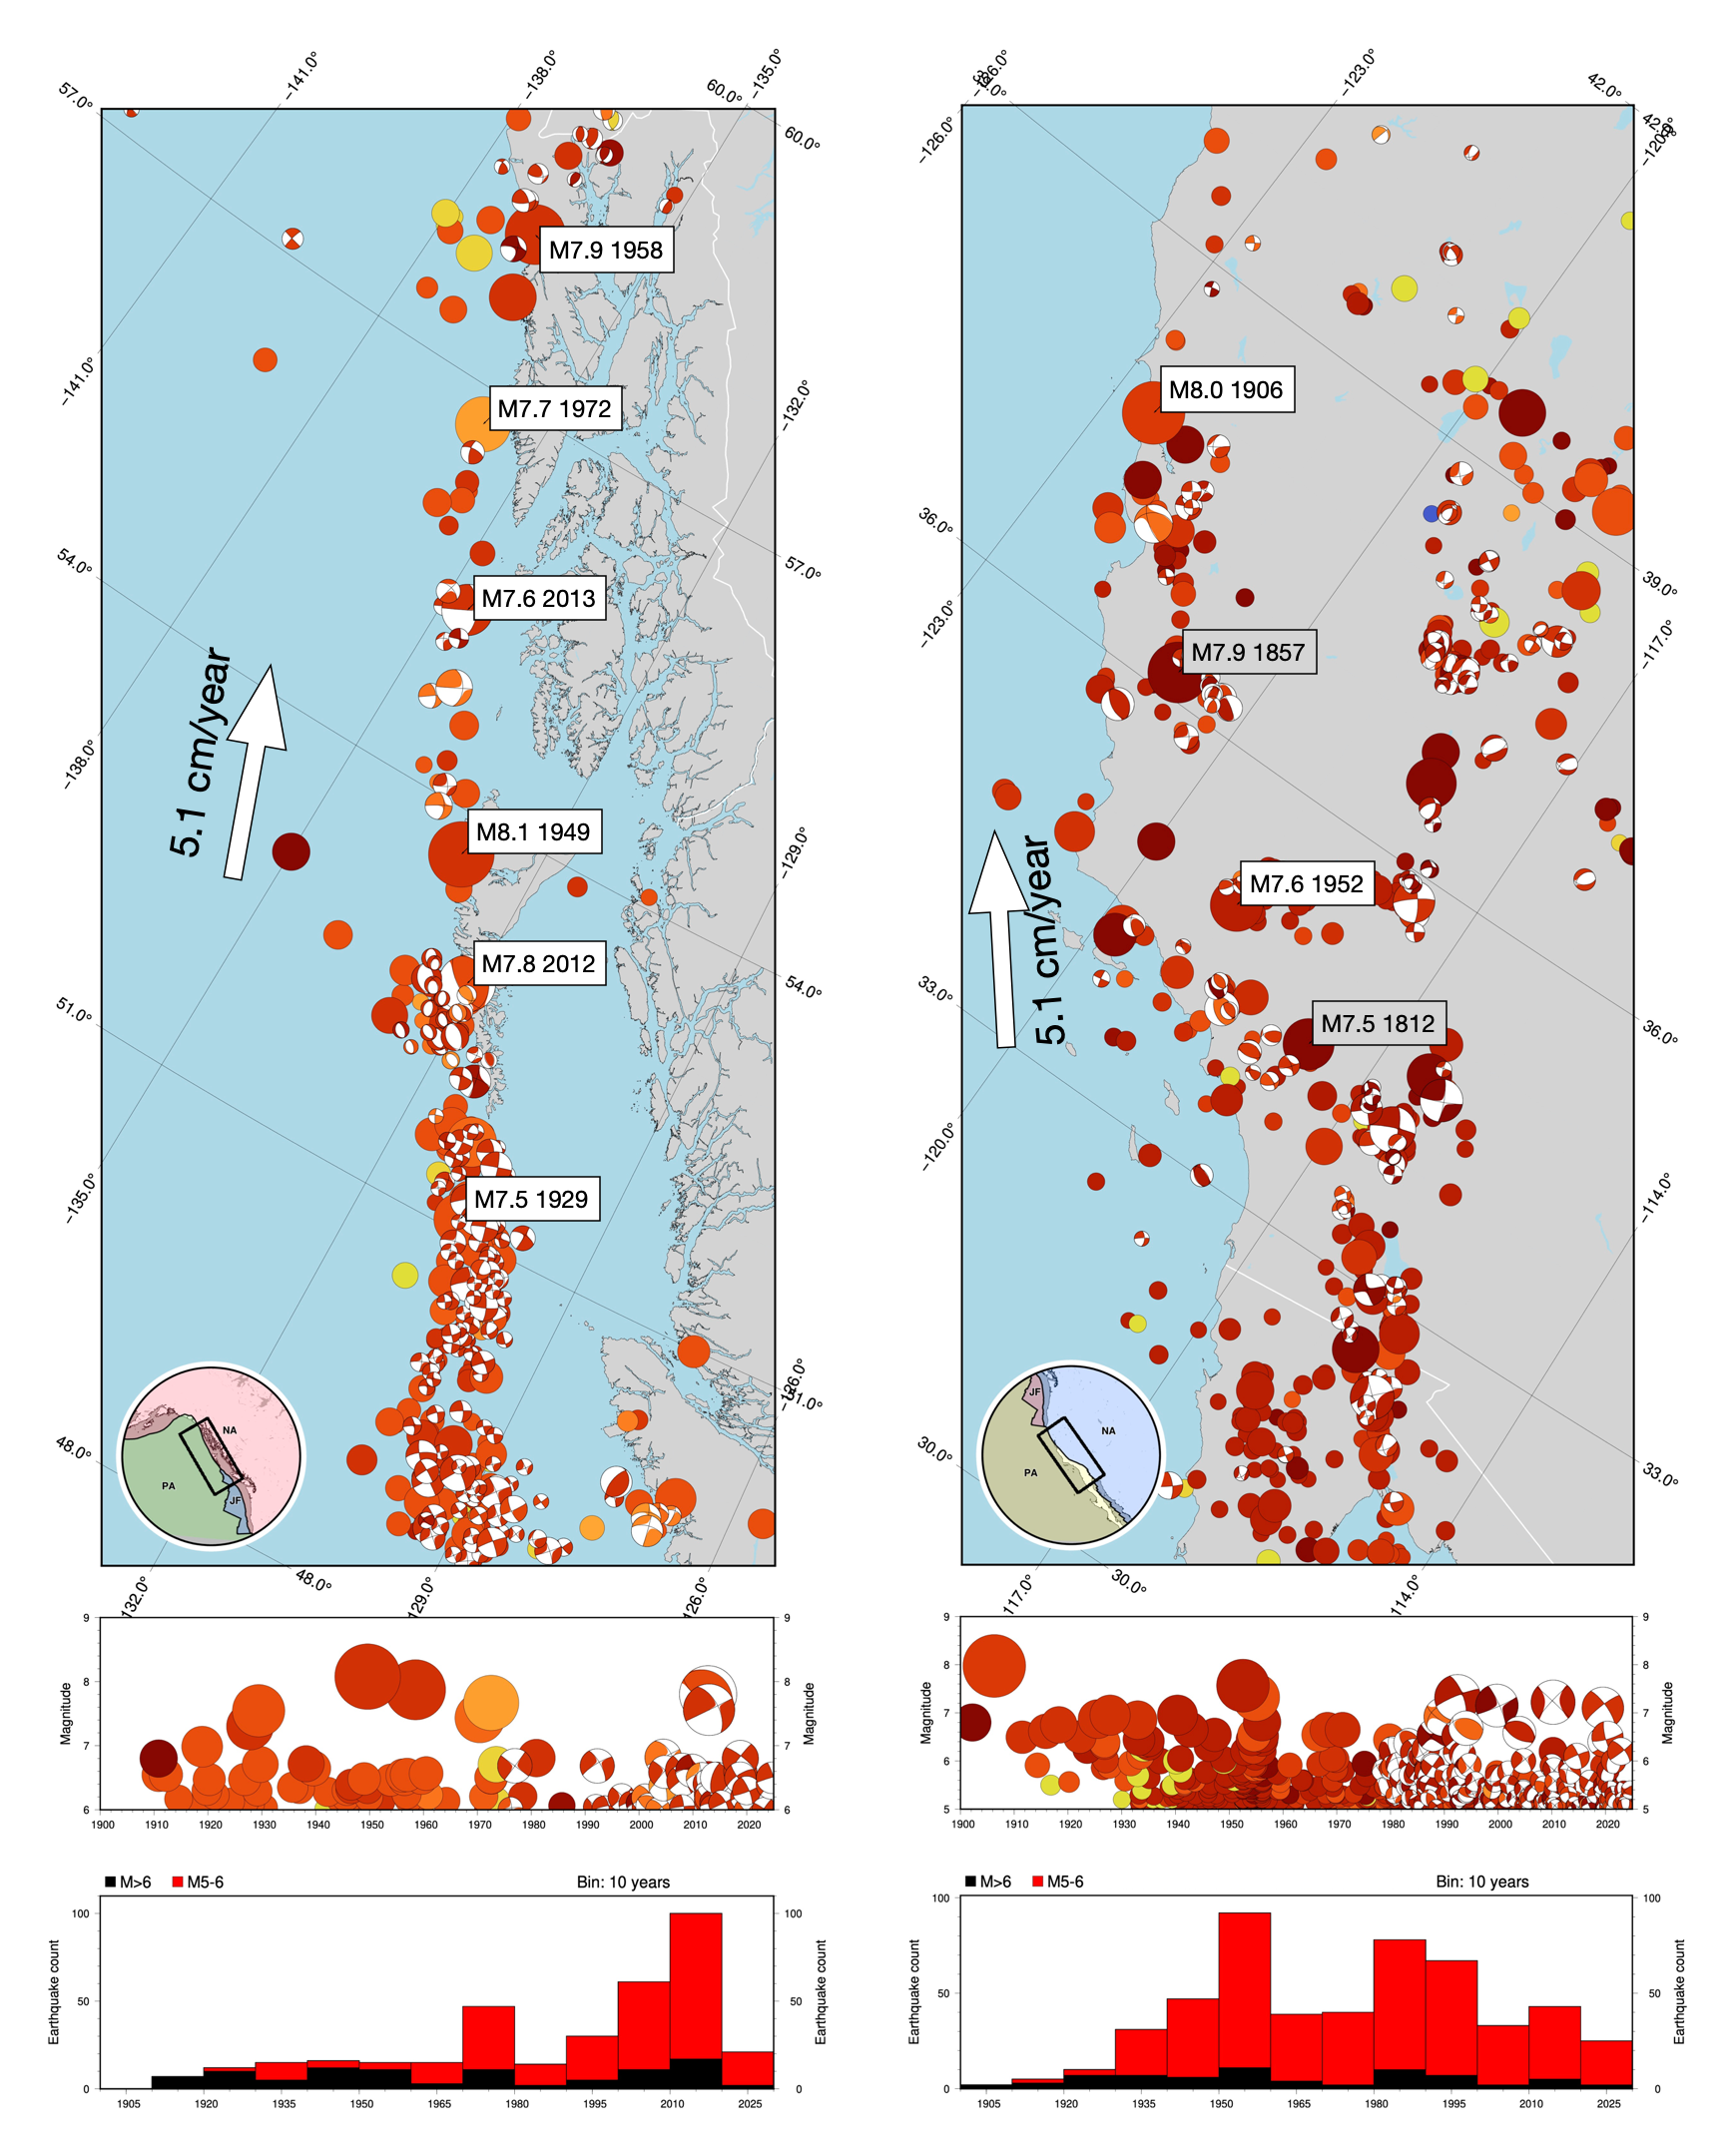
Because earthquake records over a single year can be widely variable, we decided to take a longer perspective of these two systems. The maps below shows all recorded earthquakes above magnitude 5; earthquakes above M7.5 are labelled (white if since 1900; gray for earlier events). Below the maps are timelines: first showing simply earthquakes over time, and below that, the number of events per decade. To make it easier to compare the two regions, the maps are aligned parallel to the plate boundaries, and are both 600 kilometers wide and 1300 kilometers long. (Mapping enthusiasts will recognize these as Oblique Mercator projections.)
The plate motion arrows are estimates from global plate models, and represent the total displacement of the Pacific plate with respect to stable North America (think Nebraska).
So, how do these areas compare?
First, some similarities:
The plate boundaries are juxtaposing the same two plates, for about the same length. (Our northern map does include a bit of the Juan de Fuca plate in the south, though.)
The plate motions are very similar: ~5.1 cm/yr, mostly parallel to the plate boundary.
The earthquakes are mostly strike-slip, as expected for a transform plate boundary, but there are also notable thrust events and a handful of normal-mechanism earthquakes.
On average, we see ~20-100 earthquakes above M5 each decade for each region.
The maximum recorded earthquakes are similar in magnitude: in Canada, the 1949 M8.1 Queen Charlotte Islands earthquake; in California, the 1906 M8.0 San Francisco earthquake.
So: in many ways, these two sections of plate boundary are pretty similar.
HOWEVER, there are also some really striking differences.
First, the width of the plate boundary is extremely different. The Queen Charlotte-Fairweather Fault is marked by a narrow line of earthquakes — at its widest, ~50 km. Almost all of the plate motion is taken up on that single fault. In contrast, earthquakes in California are spread across the entire map (600 km wide); in fact, we’re cutting some off! The San Andreas is only one of many faults of this complex plate boundary.
Second, while the Queen Charlotte-Fairweather Fault is located offshore (running close only to a few nearby islands), the transform fault system in California is located entirely on land.
What about the earthquakes? Above, we noted similar rates of M5+ earthquakes, and similar tectonic driving rates. However, the rates of very large earthquake aren’t the same — at least, over the last century or so. Our Canadian map includes six events above M7.5, all since 1900; two of these have occurred since 2010. In California, we have only four events above M7.5, and only two since 1900; the last one was the 1952 M7.6 Kern County earthquake.
What’s going on?
Large earthquakes occur irregularly, so it is not that surprising to see that, even with similar tectonic driving stresses and rates of moderate earthquakes, the history of large earthquakes is different for these two regions. However, it does highlight an important fact: the rate of large earthquakes in California is probably not representative of the long-term average. This phenomenon — the unusual lack of large earthquakes in California over the last century — is well known among the earthquake science community, and is described as California’s earthquake drought.
One way to visualize the impact of that drought is to consider the alternative: what if we swapped the earthquake record across these two regions? In that scenario, California would have been hit by a M7.8 eathquake on October 28, 2012 (just before Halloween). Then, less than three months later, a second large earthquake (M7.6) would have occurred, on January 5, 2013, 350 kilometers away. Two huge earthquakes, back-to-back, framing the holiday season. Even for us, who spend our lives thinking about earthquakes, it is hard to imagine a specific scenario like that.
Why didn’t these earthquakes, as they actually happened in Canada, have much actual impact? Below, we compare the population densities of the two areas. Not only is the fault system in Canada offshore, but the coast of Canada facing the plate boundary is mostly uninhabited. That stands in stark contrast to California, with its megacities.
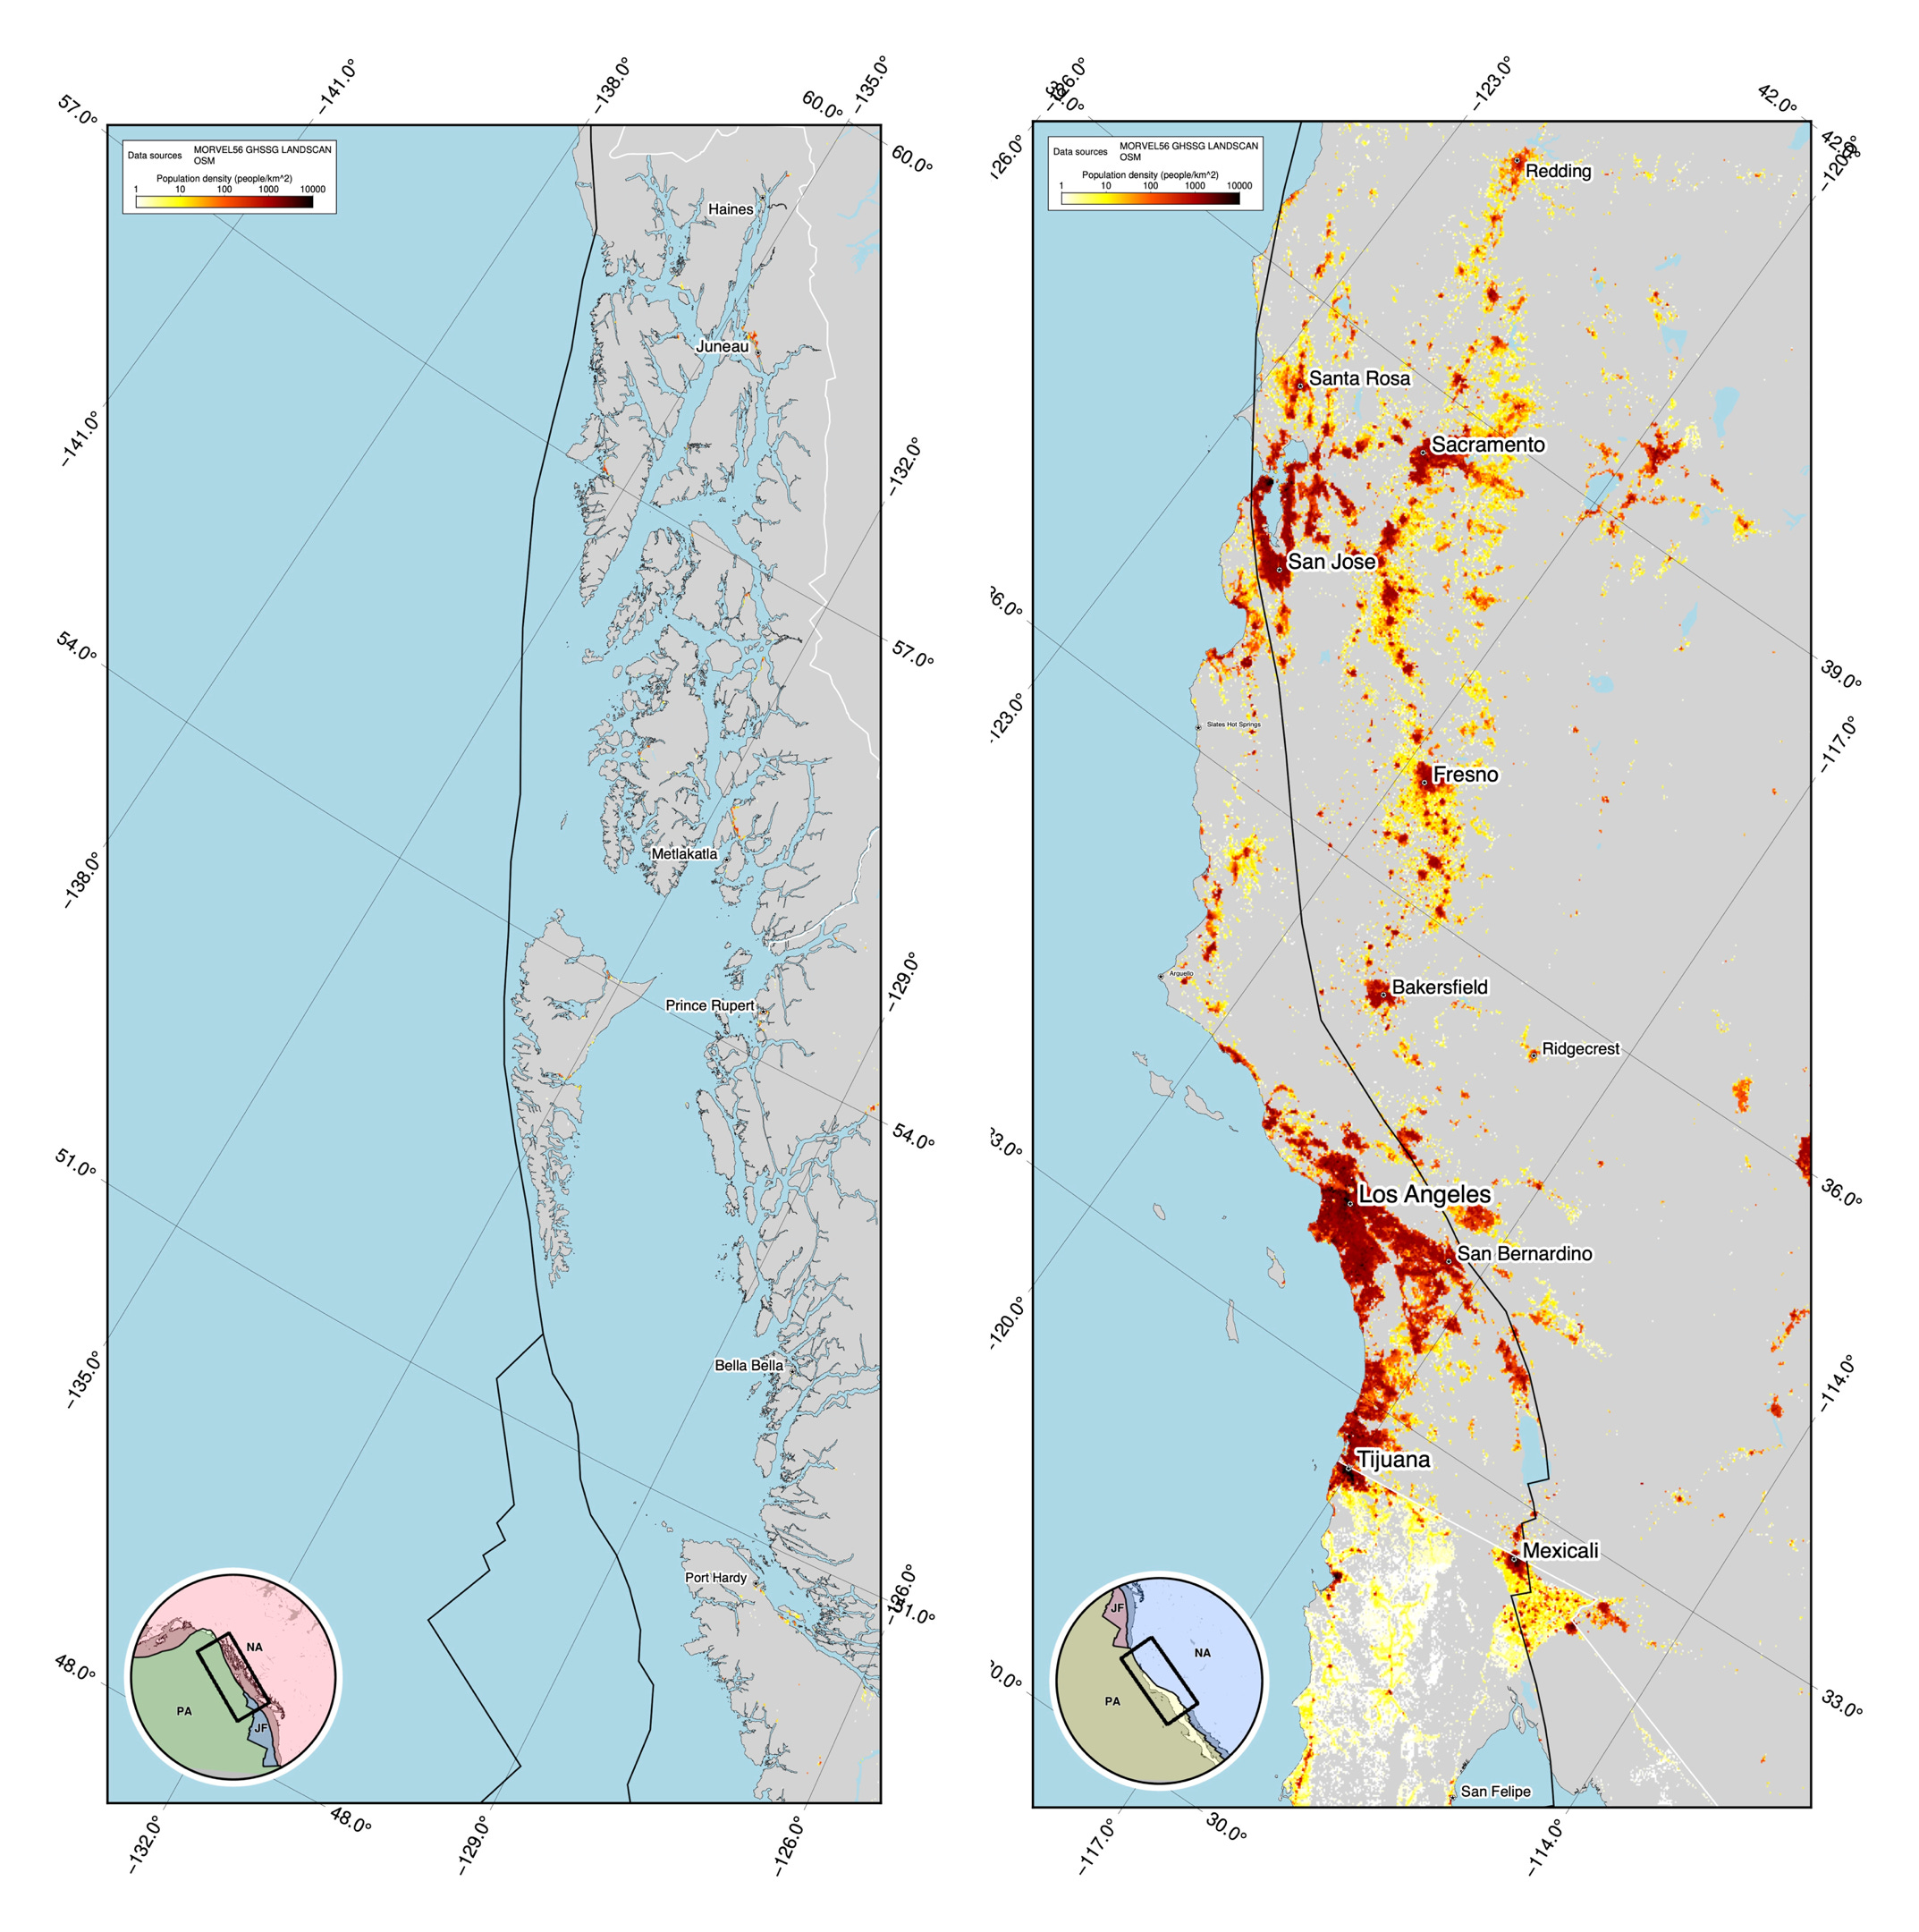
It is clear that if those events had occurred in California, that they would have had much more of an impact. Of course location in California also matters — an earthquake below Los Angeles or San Francisco would be much more dangerous than one in the eastern, low-density deserts. The fault zone in California is widely distributed, meaning that there are a lot of options for where large earthquakes can occur.
So: why didn’t these earthquakes, or others like them, occur in California in 2012 and 2013 — or any of the other years in living memory?
First, it is important to note that we can’t really just compare the histories of two completely different plate boundaries. We compared the rates of moderate earthquakes, and found they were similar; using this we guessed that the rates of large earthquakes might also be similar. On average, we tend to see about ten times as many earthquakes for every unit drop of magnitude. However, it is widely known that the ratio of large to small earthquakes can vary from region to region, something we did not investigate here.
Furthermore, just as the rate of large earthquakes in California has been low over the last century, the rate on the Queen Charlotte-Fairweather Fault could be unusualy high. While a sequence like the one in 2012/2013 is possible, it is not expected.
For a more complete perspective, we can take a look at this 2015 report from the USGS. They estimate for California that on average, one M7.5+ earthquake should occur roughly every 52 years, so about two each century, with a 48% chance of one occurring in the 30 year period following the report.

It remains true that the rate of large earthquakes in California over the last fifty years has been low — for some ineffable reason, none of the large faults in California have recently ruptured in a large earthquake, because … well … honestly, no one really knows. It remains impossible to predict earthquakes.
However, each year, the tectonic stress incrementally grows. The long-term average always wins: at some point — tomorrow, or in ten years, or fifty — California will experience those earthquakes. And as Dr. Lucy Jones wrote in an Op-Ed in 2019, “The California earthquake drought is an opportunity. Will we take it?”
References:
Aster, R., 2018. California’s other drought: A major earthquake is overdue. The Conversation. https://theconversation.com/californias-other-drought-a-major-earthquake-is-overdue-90517
Bradley, K., and Hubbard, J., 2024. M5.2 earthquake shakes south and central California. Earthquake Insights, https://doi.org/10.62481/bcfe60eb
Bradley, K. and Hubbard, J., 2024. M5.9 earthquake off the coast of Southeast Alaska. Earthquake Insights, https://doi.org/10.62481/f6e8f54d
Field, E.H., 2015. UCERF3: A new earthquake forecast for California's complex fault system (No. 2015-3009). US Geological Survey. https://doi.org/10.3133/fs20153009
Hubbard, J. and Bradley, K., 2024. Swarm offshore Vancouver Island punctuated by M6.4 earthquake. Earthquake Insights, https://doi.org/10.62481/a23a9f0a
Jones, L., 2019. The California earthquake drought is an opportunity. Will we take it? Los Angeles Times, https://www.latimes.com/opinion/op-ed/la-oe-jones-earthquake-drought-20190405-story.html
I don't see the eastern California events in this article, including Landers, Hector Mine, Ridgecrest or the ones just below the US border. I sees like those events may have reduced the stress in the southern San Andreas. Just wondering.
I’ll be sure to let him know 😁